Breaker Block(BB) Trading Explained: What It Is and How Traders Use It for High-Probability Setups
Most traders spend years learning indicators, patterns, and levels, yet still feel price moves randomly. The reason is simple. They are reading prices from the outside. Breaker block trading forces you to read price from the inside, where fakeouts, structure breaks, and momentum actually decide direction. This concept is not about predicting. It is about understanding why price moves the way it does after trapping one side of the market.

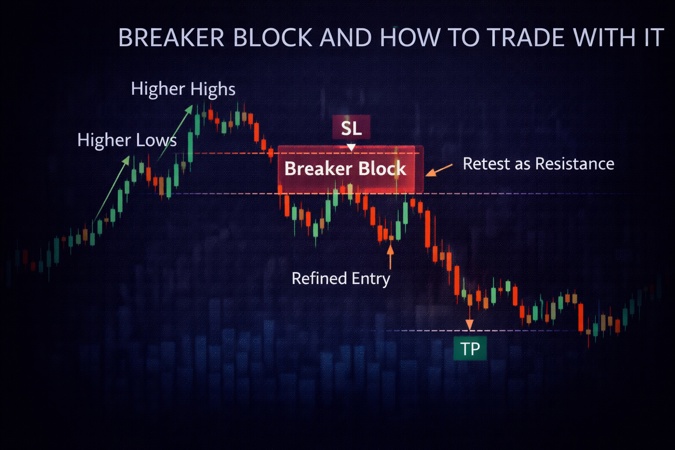
What Is a Breaker Block(BB) in Trading and How It Forms
A breaker block is a market structure concept that forms only after a liquidity sweep and a real break in structure. Price first traps traders by breaking a high or low, then reverses with strong momentum. The candle that matters is the last opposite candle before that impulsive move. When price later returns to this zone, it often reacts because it represents a failed order block where positions were shifted. Traders use breaker blocks to mark high-probability reaction areas based on real price behavior, not indicators or patterns.
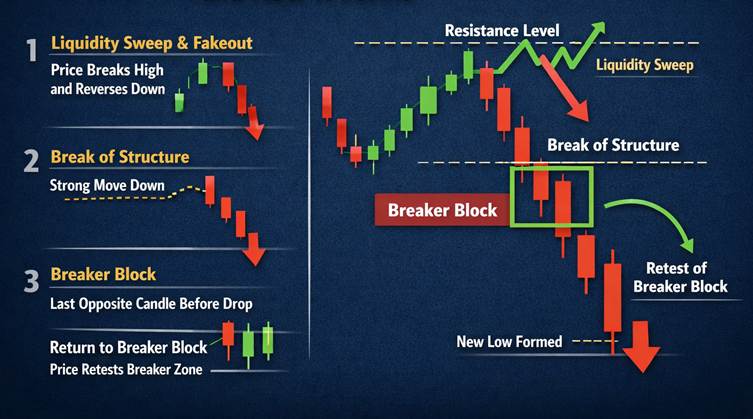
This image shows how a breaker block forms in real market conditions. Price first sweeps liquidity with a fake breakout, traps traders, then breaks structure with strong momentum. The highlighted candle is the last opposite candle before displacement, which later acts as a reaction zone when price revisits it.
After a clear liquidity sweep and break of structure, mark the breaker block and wait for price to retest it. Look for confirmation inside the zone instead of chasing the move.
Breaker Block Trading: Why This Is a High-Probability Market Structure Concept
The reason breaker block trading works so well is not magic. It stacks conditions. Liquidity sweep first. Then momentum. Then the structure breaks. When all three align, probability improves naturally.
Most price action tools fail because they ignore fakeouts. Breaker setups are built on them. This is why experienced traders wait for structure to break instead of reacting to every candle. A clean breaker block strategy only appears when the market shows its hand.
Market Structure Foundation Behind Every Breaker Block
Nothing works without structure. Every valid breaker comes after a Break in Market Structure, not a random move. A Shift in Market Structure may show slowing momentum, but only BMS creates opportunity.
If there is no liquidity sweep and no aggressive break, the setup is weak. Traders who skip this step usually blame the strategy later. This is where most confusion starts in breaker block price action.
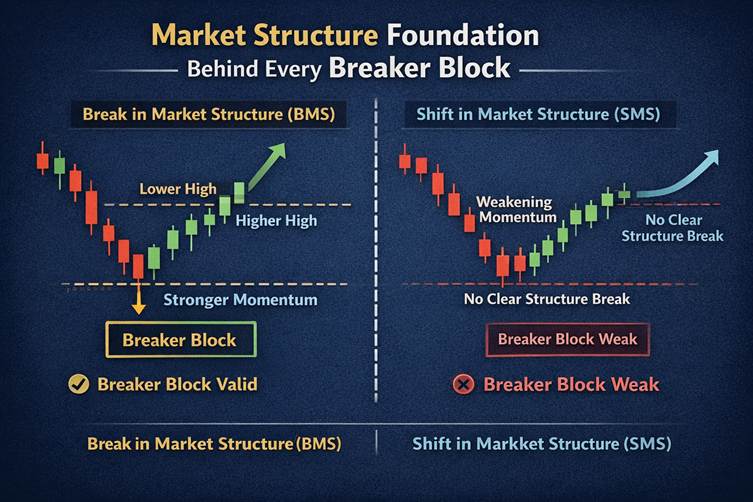
This image shows that a breaker block is valid only after a strong Break in Market Structure (BMS) with momentum. Liquidity sweep plus displacement turns the last opposite candle into a reliable breaker, while SMS setups remain weak. The solution is
Trade only breaker blocks formed after clear liquidity sweeps and strong BMS. Ignore slow or weak structure shifts.
How to Identify Breaker Block (BB)
A breaker block forms after a liquidity sweep and a strong break in market structure. The last opposite candle before the impulsive move becomes the breaker block and later acts as a reaction zone.
How to Identify a Bullish Breaker Block
A bullish breaker block forms when price sweeps a previous low, traps sellers, then breaks structure upward with strong momentum. The last bearish candle before the rally is the bullish breaker block.
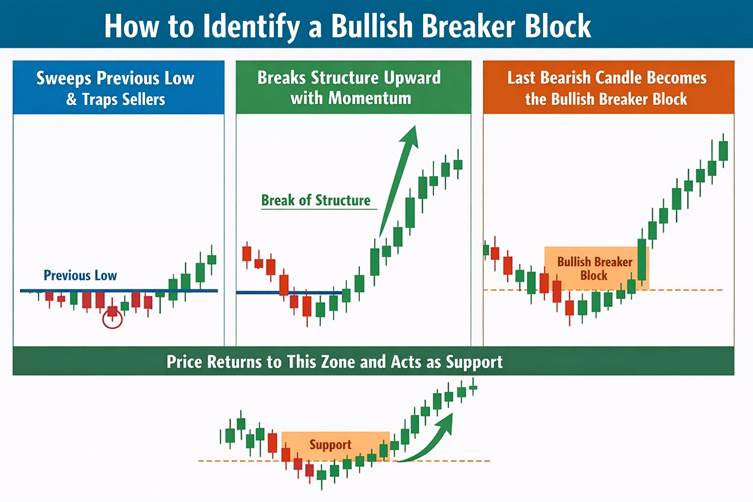
Price first sweeps sell-side liquidity by breaking a low and trapping sellers, then breaks market structure upward with strong momentum.
The last bearish candle before the impulsive move becomes the bullish breaker block and later acts as support when price retests it.
No fakeout and no strong break means no valid bullish breaker.
How to Identify a Bearish Breaker Block
A bearish breaker block forms when price sweeps a previous high, traps buyers, then breaks structure downward with momentum. The last bullish candle before the drop becomes the bearish breaker block.
Price first sweeps buy-side liquidity by breaking a high and trapping buyers, then breaks structure downward with strong momentum.
The last bullish candle before the drop becomes the bearish breaker block and later acts as resistance on a retest.
Breaker blocks form from manipulation and displacement, not candle patterns.
Breaker Block vs Order Block vs Fair Value Gap: What Traders Miss
Here is what most traders miss. When an order block fails after a fakeout, it does not become useless. It becomes a breaker. That is why breaker block vs order block is not a debate. One evolves into the other.
This is also why price often reacts at breakers before filling a fair value gap. Traders waiting only for FVGs get left behind. Understanding this relationship is part of smart money breaker block setup, not a separate concept.
Breaker Block Trading Strategy: Entry, Risk, and Context
Breaker block trading is not about perfect entries. It is about zones. Some traders enter near the top of the breaker. Others wait near the midpoint. Both work if context is correct. This is the logic behind trading breaker blocks with retest.
Stop loss does not go tight under the candle wick. Real markets are not perfect. Stops belong beyond structure or candle bodies. Targets are not fixed ratios. Liquidity pools decide exits. This approach works across markets, including breaker block forex trading and breaker block crypto strategy, because price behavior stays the same.
Final Perspective
Breaker blocks do not make trading easy. They make it clearer. Breaker block trading helps you understand why price ignores levels, why it reverses early, and why momentum matters more than patterns.
Used alone, it will fail. Used with structure, liquidity, and practice, it becomes one of the most reliable tools in price action. This is not about shortcuts. It is about reading price the way it actually moves.
Responses (0)
Leave a Reply
Your email address will not be published. Required fields are marked *
You might also like

Basics of Technical Analysis: A Beginner’s Guide to Reading Price, Charts and Candlesticks
Technical Analysis is the study of price charts to understand how buyers and sellers are behaving in the market. It is not about predicting prices or relying on indicators. Most beginners struggle not because charts are complex, but because they misinterpret what candlesticks, trends and patterns are actually showing. Technical analysis works across stocks, forex, crypto and commodities because human behavior drives all markets. This guide explains the basics of technical analysis in a clear, practical way, focusing on real price behavior, common beginner mistakes and how traders actually use charts to make informed decisions instead of guessing.

Market Trend Analysis Explained: Market Cycles, Accumulation and Distribution in Trading
Market trend analysis explains how price moves through structure, cycles and phases rather than predicting direction. Markets trend, pause, accumulate, distribute and repeat this process across all time frames. Trend analysis identifies whether price is making higher highs, lower lows, or compressing sideways, while market cycles explain why these structures form and reset. Accumulation and distribution occur inside consolidation, where institutions quietly build or exit positions before expansion or decline. When traders combine structural trend reading with market cycle awareness, they stop reacting to noise and start understanding where price is in the larger process.