How to Identify Breakout or Fakeout: A Professional Guide to Breakout Trading and Fakeout Trading

Introduction
Market trend analysis is not about predicting where price will go next. It is about understanding what price is doing now, why it is behaving the way it is and which phase of the market you are operating within.
Most traders struggle not because markets are chaotic, but because they attempt to reduce a layered system into a single idea. They want direction without structure, signals without context and certainty without patience.
Real markets do not move in straight lines. They move through structure, cycles and shifting phases of participation. This article explains trend analysis, market cycles and the accumulation–distribution framework the way experienced traders actually use them - a unified market-reading system rather than a collection of isolated concepts.
What Trend Analysis and Market Cycles Actually Explain
Trend analysis and market cycles together explain one thing that matters more than any indicator:
Why price moves the way it does.
Trend analysis explains how price is progressing structurally through highs, lows and pauses.
Market cycles explain why that structure keeps repeating over time.
When structure is viewed without cycles, traders misread pauses as reversals.
When cycles are viewed without structure, traders chase narratives instead of price.
Professional traders combine both. They understand that price movement is the result of order flow, positioning and human behavior, not randomness.
Once this clicks, markets stop feeling unpredictable. Even volatility starts to make sense.
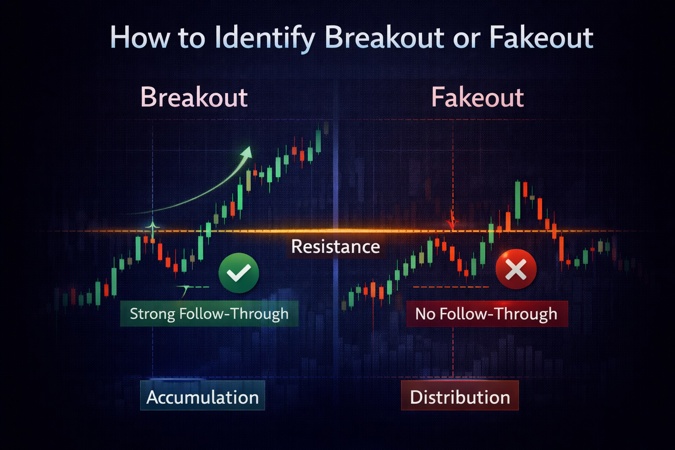
Why Visual Trend Guessing Fails Most Traders
Most traders define trend visually. If price is going up, they assume it is bullish. If price is falling, they assume it is bearish. This definition is shallow and, over time, expensive.
Price can rise while distribution is taking place. Price can fall while accumulation is building underneath.
Visual trend guessing ignores how price is behaving internally. It leads traders to buy strength that is already exhausted and sell weakness that is about to reverse.
Structural trend analysis replaces guessing with observation. It forces traders to wait for confirmation instead of reacting to movement.
That single shift separates professionals from participants.
The Three Market Directions Explained Structurally
Markets can move in only three ways:
- Up
- Down
- Sideways
There is no fourth state.
What changes is how each state is identified.
Each direction has a structural signature. Until a trader learns to read that structure, they are trading emotion disguised as analysis.
Swing Highs and Swing Lows: The Foundation of Trend Structure
Price does not move smoothly. It moves in swings.
Every swing high and swing low represents a decision point where buying pressure met selling pressure. These swings are not noise. They are the skeleton of market structure.
Indicators attempt to summarize swings after the fact. Professionals read them directly.
If a trader cannot consistently identify meaningful swing highs and swing lows, they cannot identify trend, strength, or failure. Everything else becomes guesswork layered on top.
Higher Highs, Higher Lows, Lower Highs, Lower Lows
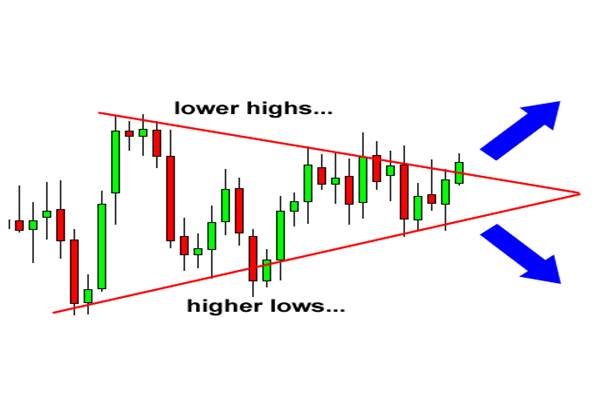
Trends are confirmed or weakened by the sequence of highs and lows, not by candle color or short-term movement.
This is where trend analysis becomes precise.
- Uptrend: Higher highs and higher lows
- Downtrend: Lower highs and lower lows
- Sideways: No consistent progression
Trends strengthen as this sequence continues, weaken when one side fails and end when structure breaks. This logic applies across all markets and time frames, including the Indian stock market. Assets change. Behavior does not.
When Markets Stop Trending: Sideways Phases and Structural Pauses
Trends are not permanent.
At some point, progress slows. Highs stop extending. Lows stop following. Price compresses into a range. This is not randomness. It is transition.
Sideways phases appear when markets need time to absorb positions, transfer ownership and reset expectations. Traders lose money here because they continue trading a trend that no longer exists.
Understanding when not to trade is part of trend mastery.
Trends Inside Trends: Fractals, Time Frames and Dow Theory Applied
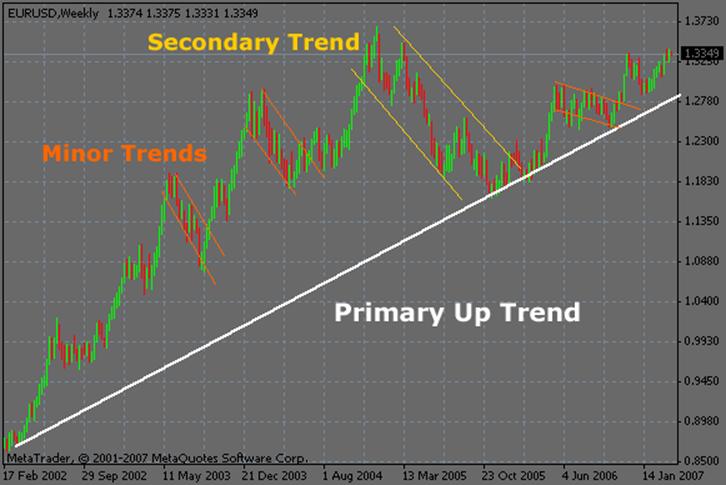
Dow Theory example illustrating primary, secondary, and minor trends that form the overall market direction.
Price is fractal - a primary trend can remain intact even while secondary and intraday trends move in the opposite direction
A market can be bullish on one time frame and bearish on another at the same time.
This is not contradiction. It is fractal behavior.
Dow Theory described this through primary, secondary and minor trends. Modern charts simply expose it more clearly.
Higher time frames always dominate lower ones. When traders ignore this hierarchy, confusion is guaranteed. When they respect it, structure aligns.
What a Market Cycle Really Is (Beyond Popular Diagrams)
Market cycles are often reduced to neat diagrams showing emotions. Those diagrams are helpful but incomplete.
A market cycle is the rotation between accumulation, expansion, distribution and decline, driven by institutional positioning and human behavior.
Cycles repeat because behavior repeats. Fear, greed, impatience and denial do not change with technology. They only change speed.
Consolidation Explained: The Neutral Zone of the Market
Consolidation is neutral by nature. It is neither bullish nor bearish. Price moves sideways because large participants cannot build or exit positions aggressively without moving price against themselves.
Direction becomes clear only after confirmation, not during consolidation. Prediction in this phase is speculation. Structure after resolution is information.
Accumulation and Distribution Inside Consolidation
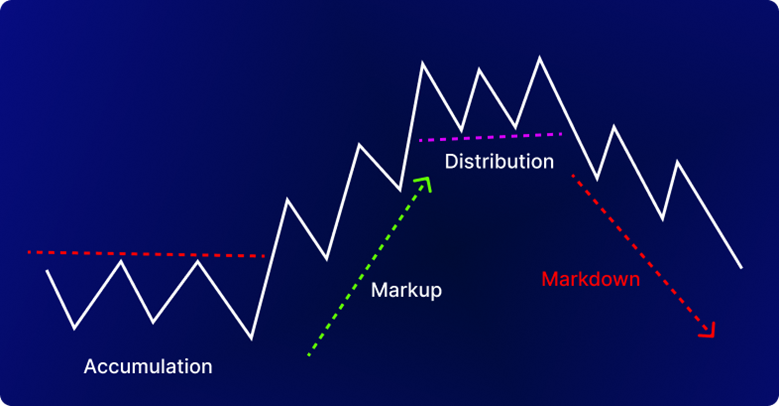
This market cycle illustrates how accumulation leads to markup, distribution precedes markdown, and why every major trend is built and unwound in phases
Both accumulation and distribution occur within consolidation. Accumulation is the process through which institutions quietly build positions. Distribution is the process through which they gradually exit those positions.
The critical rule most traders miss is simple: accumulation or distribution can only be labeled after the breakout or breakdown. Before that point, it is consolidation. Experience may suggest probabilities, but structure confirms reality.
From Accumulation to Markup and Distribution to Markdown
Once accumulation completes, markup begins. Once distribution completes, markdown follows. Trends are born from accumulation and end through distribution. Breakouts are not random events and breakdowns are not accidents. They are the visible result of positioning that occurred quietly beforehand.
Understanding this relationship permanently changes how charts are read.
Re-Accumulation, Re-Distribution and the Complete Market Framework
Trends do not move in one clean wave.
Inside trends, markets pause to re-accumulate before continuation or re-distribute before further decline. These internal cycles appear on every time frame because price is fractal.
When traders combine trend structure with market cycles, they stop predicting and start reading.
That is the difference between traders who survive cycles and those who disappear during them.
Final Perspective
Market trend analysis is not about being right on every trade. It is about understanding where you are in the larger process. When traders know whether price is trending, pausing, accumulating, or distributing, decisions slow down. Risk becomes clearer. Patience becomes natural.
Markets reward those who read structure, respect cycles and wait for confirmation. Everything else is noise.
FAQs
1. How is market trend analysis different from predicting price direction?
Market trend analysis explains how price is behaving now, not where it might go. It focuses on structure and confirmation instead of prediction.
2. Can accumulation or distribution be identified before a breakout?
No. Accumulation and distribution are confirmed only after a breakout or breakdown. Before that, price is simply consolidating.
3. Does trend analysis work on all markets and time frames?
Yes. The same trend and market cycle logic applies to stocks, indices, forex, crypto and the Indian stock market across all time frames.
4. Why do markets move sideways for long periods?
Markets move sideways when large players are building or exiting positions quietly. This phase absorbs liquidity before the next move.
Responses (0)
Leave a Reply
Your email address will not be published. Required fields are marked *
You might also like

Basics of Technical Analysis: A Beginner’s Guide to Reading Price, Charts and Candlesticks
Technical Analysis is the study of price charts to understand how buyers and sellers are behaving in the market. It is not about predicting prices or relying on indicators. Most beginners struggle not because charts are complex, but because they misinterpret what candlesticks, trends and patterns are actually showing. Technical analysis works across stocks, forex, crypto and commodities because human behavior drives all markets. This guide explains the basics of technical analysis in a clear, practical way, focusing on real price behavior, common beginner mistakes and how traders actually use charts to make informed decisions instead of guessing.

Market Trend Analysis Explained: Market Cycles, Accumulation and Distribution in Trading
Market trend analysis explains how price moves through structure, cycles and phases rather than predicting direction. Markets trend, pause, accumulate, distribute and repeat this process across all time frames. Trend analysis identifies whether price is making higher highs, lower lows, or compressing sideways, while market cycles explain why these structures form and reset. Accumulation and distribution occur inside consolidation, where institutions quietly build or exit positions before expansion or decline. When traders combine structural trend reading with market cycle awareness, they stop reacting to noise and start understanding where price is in the larger process.