Liquidity in Trading Explained: How Internal and External Liquidity Decide Price Direction
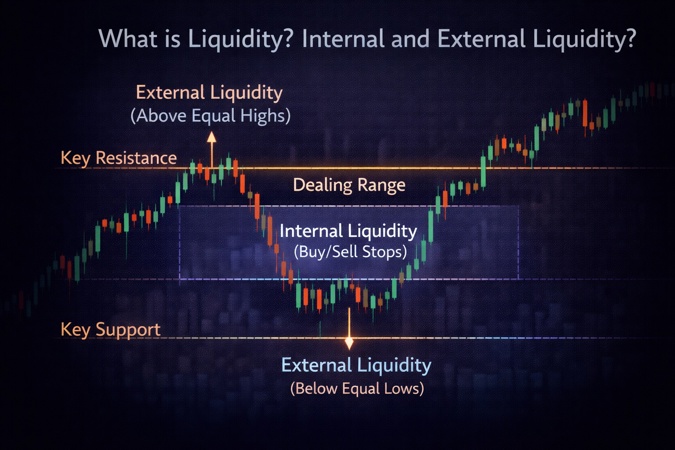
Liquidity in Trading explains why price moves where it moves. Price does not react to patterns or indicators, it moves toward areas where orders are resting. Internal liquidity forms inside a dealing range through equal highs, equal lows, gaps, and inefficiencies. External liquidity sits above highs and below lows and acts as the next destination. Price first absorbs nearby liquidity, then expands toward the next pool. Most fake breakouts are liquidity sweeps designed to trigger stops before the real move begins. When traders understand liquidity, targets become logical, entries become cleaner, and price stops feeling random.

What Is Liquidity in Stock Market and Why It Drives Price
Most traders hear the word liquidity and think volume or speed, but that confusion is exactly why price feels random to them. In reality, what is liquidity in the stock market comes down to one thing: where orders are sitting and where price can consume them. Price does not move because of indicators or patterns, it moves because orders exist at specific locations.
From real chart observation, every major move starts from liquidity being taken. This is why liquidity in trading is described as the soul of price action in the script. Liquidity shows where manipulation happened, where stop losses were hunted, and where smart money entered buy or sell positions.
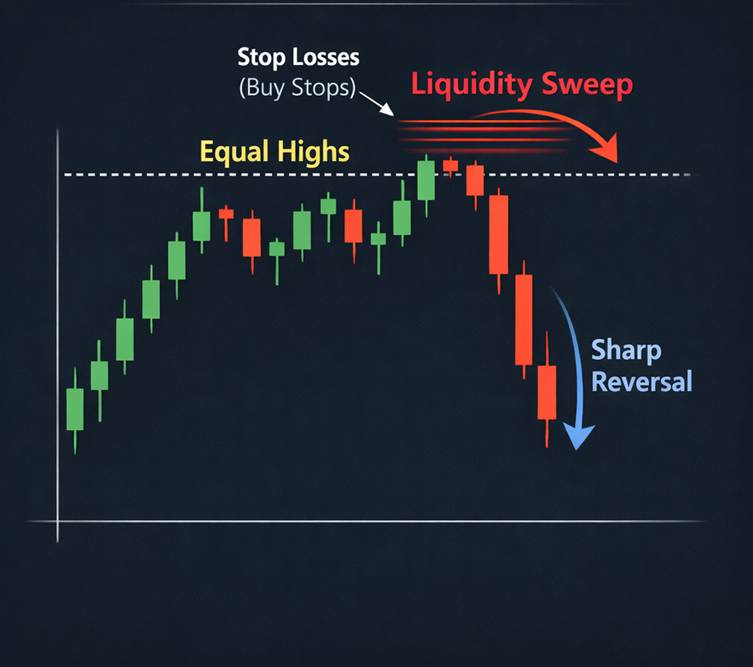
This image shows buy-side liquidity resting above equal highs. Price sweeps those stop losses, absorbs orders, and then sharply reverses. It demonstrates how markets move to consume liquidity before expanding in the true directional move.
Liquidity in Trading: Why Price Moves Where It Moves
Traders often ask why price ignored one level and respected another, even when both looked technically strong. The answer is simple once you understand liquidity concepts in trading. Price is always searching for orders, not reacting to patterns.
In live markets, liquidity in trading explains why price first moves against traders before moving in the expected direction. That initial move is not failure, it is price absorbing liquidity so it can travel efficiently toward the next objective.
What Is Dealing Range in Trading and How to Identify It
In real trading, a dealing range is simply the price range where the market is currently doing business and where you are trying to decide the next move. Traders often misunderstand it as any random consolidation, but in practice it is defined by the most recent genuine swing high and swing low between which price is trading right now. That range tells you where price is negotiating orders, not where it has already finished its job.
To identify a dealing range, look at where price is actively trading and mark the last valid swing high and swing low that would invalidate the trend if broken. That zone becomes your working range. Everything inside it is internal liquidity, and everything outside it is external liquidity. Once you see this clearly on the chart, you stop guessing direction and start reading where price is likely to go next based on which liquidity side gets absorbed first.
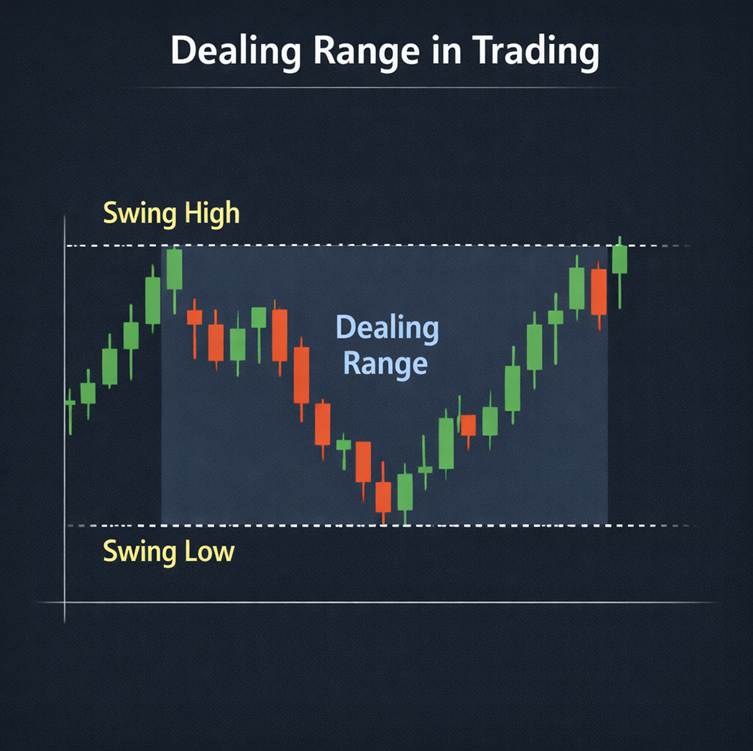
This image defines a dealing range between a valid swing high and swing low. Price trades within this boundary, negotiating orders. The range structure helps traders distinguish where internal liquidity forms and where external liquidity rests.
Internal Liquidity and External Liquidity Explained Using Dealing Range in Trading
The biggest mistake traders make is not defining the range they are trading in. Once a dealing range in trading is clearly marked between a genuine swing high and swing low, liquidity automatically divides into two types. Everything inside the range becomes internal, and everything outside becomes external.
Internal liquidity and external liquidity are not abstract ideas. Internal liquidity includes fair value gaps, order blocks, breakers, equal highs or lows inside the range. External liquidity sits above the range high or below the range low and acts as the next major destination for price.
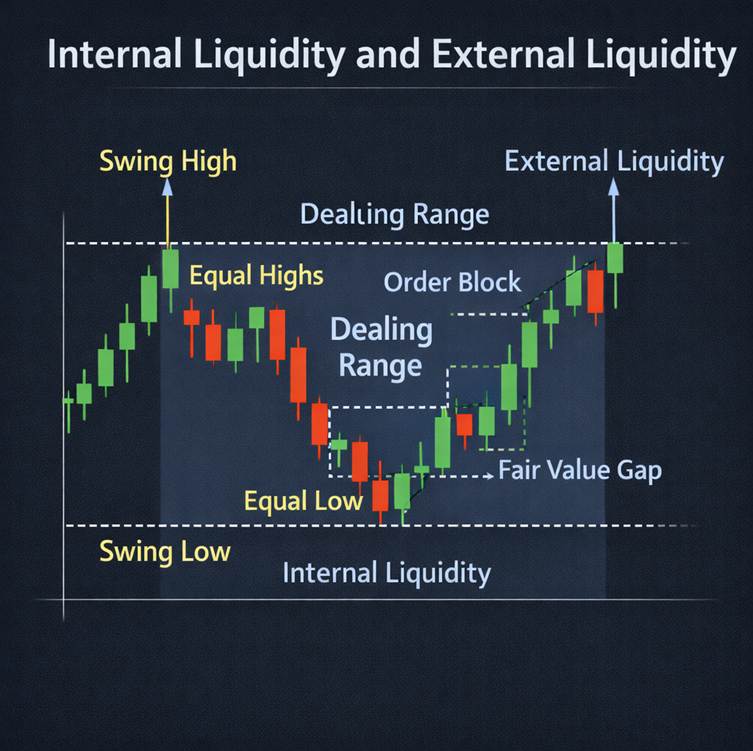
This chart separates liquidity inside the dealing range from liquidity outside it. Equal highs, equal lows, order blocks, and fair value gaps represent internal liquidity, while levels beyond the range high and low represent external liquidity targets.
How Smart Money Uses Liquidity to Move Price Between Ranges
Traders think smart money predicts direction, but in reality how smart money uses liquidity is systematic. Price first moves to absorb nearby liquidity, then creates new liquidity, and only after that expands toward the next external objective.
This is why liquidity in price action looks like price moving in steps rather than straight lines. Internal liquidity is absorbed first, then price reaches for external liquidity, then creates a new dealing range and repeats the same process again.
Liquidity Sweep Trading: Why Price Targets Stops Before Directional Moves
Many traders panic during fake breakouts because they don’t understand liquidity sweep trading. When price breaks a high or low and immediately reverses, it is targeting buy side liquidity and sell side liquidity placed by retail traders.
A liquidity grab in trading is not a mistake or failure. It is a necessary process where price removes resting orders so it can move cleanly. Once the liquidity is absorbed, direction becomes clearer and smoother.
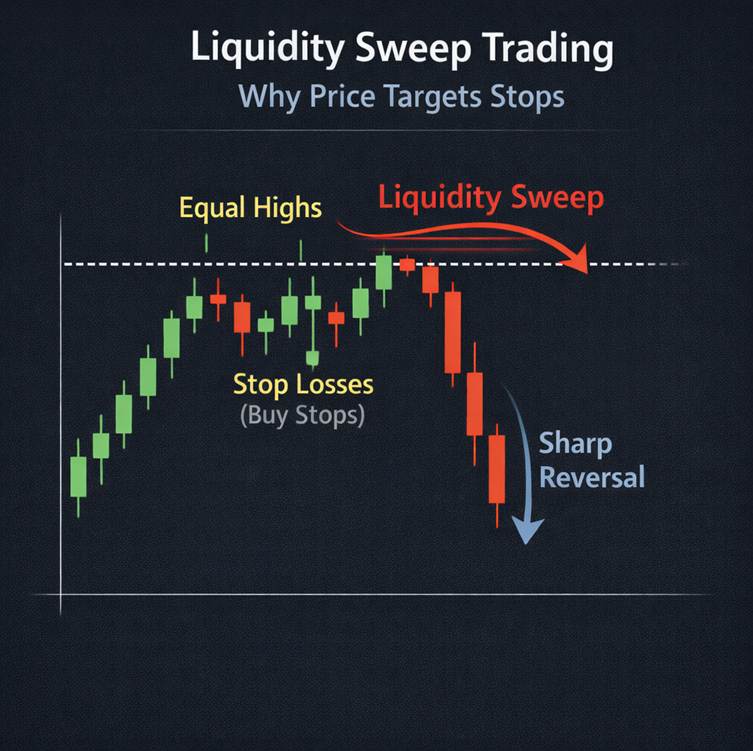
This image illustrates a liquidity sweep where price breaks above equal highs to trigger stop losses. After absorbing buy-side liquidity, price reverses strongly. It highlights how stop hunts occur before the market commits to a directional move.
Liquidity Zones in Price Action and How Price Absorbs Orders
Every zone price reacts from has a reason. Liquidity zones in price action exist because orders were left unfilled there. Price treats these zones like magnets and revisits them to rebalance inefficiencies.
This is why liquidity forex trading, crypto, and stock markets behave the same way. The instrument changes, but the logic doesn’t. Price always moves from one liquidity zone to another while creating new internal and external liquidity along the way.
Liquidity in Trading: How Internal and External Liquidity Decide Targets
When traders miss targets, it’s usually because they didn’t identify which liquidity was already consumed. If external liquidity is taken, price naturally looks for internal liquidity next to rebalance.
This rotation explains why liquidity in trading gives more accurate targets than indicators. Internal liquidity acts as reaction points, while external liquidity defines where price ultimately wants to go.
Final Practical Framework for Reading Liquidity Without Indicators
You don’t need indicators once you can see where liquidity is forming and getting consumed. Define the dealing range, mark internal liquidity zones, and identify where external liquidity is resting.
This framework works because liquidity in trading explains why highs and lows form where they do. Swing highs and swing lows are not random, they are created at liquidity locations where orders existed.
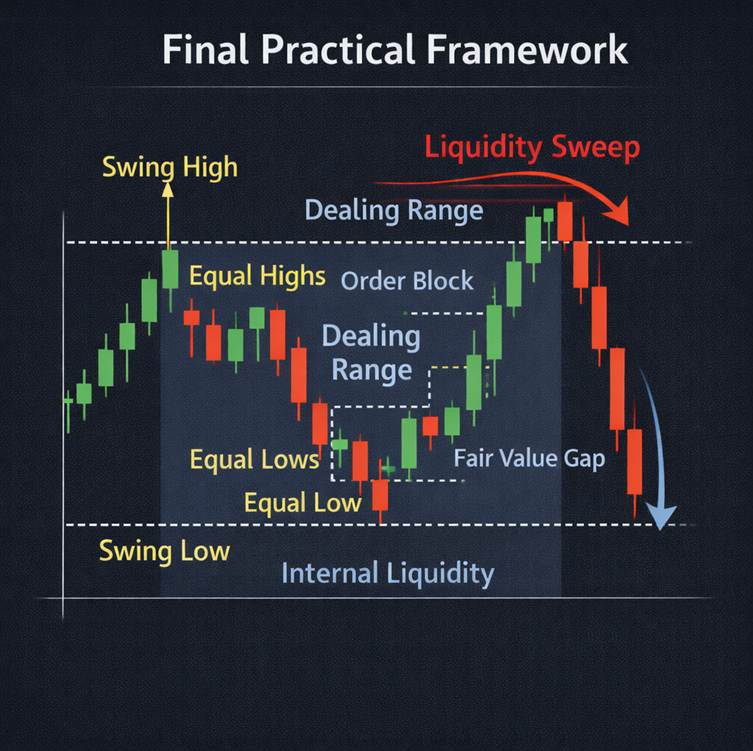
This chart combines the full liquidity framework: dealing range, internal liquidity, external liquidity, liquidity sweep, and expansion. It visually explains how price absorbs internal liquidity first, then targets external liquidity, forming structured and repeatable market movements.
FAQs
1. How do traders know whether price will target internal or external liquidity first?
Price usually moves toward the liquidity that has not been taken yet. After external liquidity is absorbed, price often returns to internal liquidity, and after internal liquidity is cleared, it expands outward again.
2. Why does price often reverse after breaking a high or low?
Because the move is often a liquidity sweep, not a real breakout. Price takes stop losses above highs or below lows, then reverses once that liquidity is absorbed.
3. Is liquidity analysis useful without multi-timeframe analysis?
Yes. Liquidity can be read on any timeframe if the dealing range is clear. Higher timeframes show bigger targets, while lower timeframes show how liquidity is absorbed.
4. Why does price pause or consolidate before a strong move?
Price consolidates to create internal liquidity. During this phase, buy and sell orders build inside the range. Once enough liquidity forms, price expands toward external liquidity. Consolidation is preparation, not indecision.
5. How can traders avoid entering during false moves around liquidity zones?
By waiting for liquidity to be swept first. Most false moves happen when traders enter before stops are taken. When price sweeps nearby liquidity and then reacts, direction becomes clearer and false entries reduce.
Responses (0)
Leave a Reply
Your email address will not be published. Required fields are marked *
You might also like

Basics of Technical Analysis: A Beginner’s Guide to Reading Price, Charts and Candlesticks
Technical Analysis is the study of price charts to understand how buyers and sellers are behaving in the market. It is not about predicting prices or relying on indicators. Most beginners struggle not because charts are complex, but because they misinterpret what candlesticks, trends and patterns are actually showing. Technical analysis works across stocks, forex, crypto and commodities because human behavior drives all markets. This guide explains the basics of technical analysis in a clear, practical way, focusing on real price behavior, common beginner mistakes and how traders actually use charts to make informed decisions instead of guessing.

Market Trend Analysis Explained: Market Cycles, Accumulation and Distribution in Trading
Market trend analysis explains how price moves through structure, cycles and phases rather than predicting direction. Markets trend, pause, accumulate, distribute and repeat this process across all time frames. Trend analysis identifies whether price is making higher highs, lower lows, or compressing sideways, while market cycles explain why these structures form and reset. Accumulation and distribution occur inside consolidation, where institutions quietly build or exit positions before expansion or decline. When traders combine structural trend reading with market cycle awareness, they stop reacting to noise and start understanding where price is in the larger process.