Market Structure Trading Explained: How to Read Trends Using BOS, BMS, SMS and Price Action
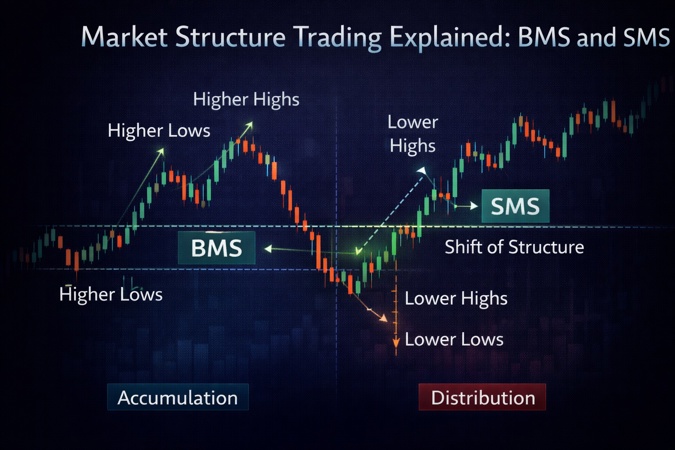
Market structure explains how trends form by studying price highs and lows, not indicators. An uptrend shows higher highs and higher lows, a downtrend shows lower lows and lower highs, and sideways markets rotate without direction. A Break of Structure (BOS) signals change but is not a trade by itself. Break in Market Structure (BIMS) includes a fakeout and liquidity sweep, making it higher probability. Shift in Market Structure (SMS) changes gradually and needs two breaks, but has lower probability. Reading structure near current price helps traders identify trend direction, avoid traps, and trade with better probability using price action.

What Market Structure Means and How Trends Are Defined
Market structure, in simple terms
Market structure refers to how price moves by forming highs and lows over time. It is the most direct way to understand what the market is doing. Every chart, regardless of instrument or timeframe, follows this same behavior.
Price builds structure through swing highs and swing lows. These swings are not random. Over time, they form sequences that reveal whether the market is trending or not.
When price consistently creates higher highs and higher lows, the market is in an uptrend. When price forms lower lows and lower highs, the market is in a downtrend. When price fails to do either and rotates between a high and a low, the market is sideways.
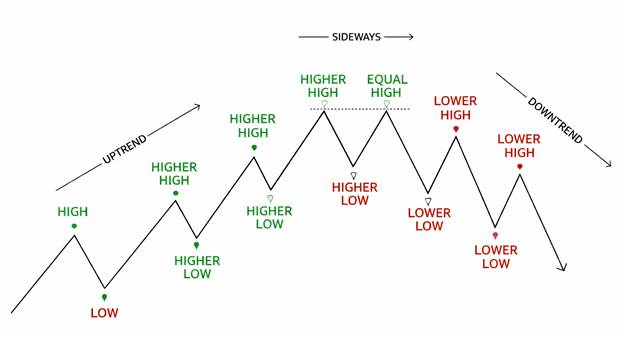
This diagram shows how price behaves. In an uptrend, highs break and higher lows hold, meaning buyers are in control. In a downtrend, rallies fail and lower lows continue, meaning sellers control direction. In a sideways market, highs and lows stay equal, showing balance and no clear control.
What to do:
Trade pullbacks in trends. Avoid forcing trades in sideways conditions.
Why Market Structure Matters More Than Indicators
The limitation of indicator-based thinking
Most traders focus on signals. They wait for indicators to confirm entries. The problem is that indicators respond after the price has already moved.
Market structure works differently. It explains why the price moved instead of reacting after the move. By reading structure, traders understand whether price is continuing, correcting, or preparing to change direction.
This approach naturally stops traders from chasing every breakout and from forcing trades in unclear conditions. Structure filters low-quality setups without adding complexity.
Consistency comes from context, not confirmation
Trading consistency comes from reading prices the same way every day. Market structure supports that consistency by keeping traders aligned with the actual market state instead of indicator signals.
Foundations You Must Understand Before Market Structure
How to read candles correctly
Candlesticks should be viewed as information, not signals. A candle shows acceptance, rejection, strength, or hesitation at a price level. It does not give trading instructions on its own.
Why swings matter more than patterns
Swing highs and swing lows are the building blocks of structure. Without identifying swings, structure cannot exist.
Higher highs and higher lows are not patterns. They represent control. One side of the market is pushing price successfully while the other side is failing to stop it. The real purpose of technical analysis is to understand this control, not to predict outcomes.
Candlesticks confirm whether structure is accepted or rejected. A close above a previous high shows’ acceptance and continuation. A close below a previous low confirms selling pressure. Wicks only show testing. Closes decide structure.
What you should do
Don’t react to wicks. Let the candle close.
Only treat structure as valid after acceptance, not during intrabar movement.
Break of Market Structure (BOS): Meaning and Misconceptions
What a BOS actually tells you
A break of market structure occurs whenever price breaks a previous high or low. Technically, every such break is a BOS.
This is where many traders get confused. Not every BOS is a trading signal.
A BOS only tells you that the structure has changed. It does not tell you whether the change is strong, weak, temporary, or meaningful. Treating every break the same way leads to poor decisions and unnecessary losses.
Understanding BOS correctly means understanding how the break occurred, not just that it occurred.
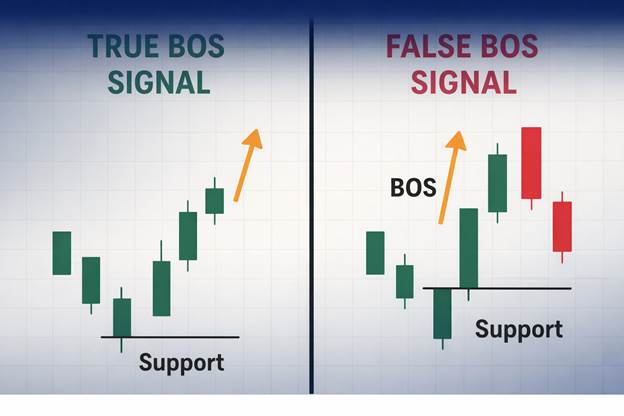
Here price breaks a previous high, so technically it is a BOS. But notice where it happens. The break occurs directly into support. There is no displacement, no follow-through, and price immediately stalls.
This is where traders confuse structure change with trade opportunity. The market changed structure, but control did not change.
BMS vs SMS: Two Types of Structure Change
Why structure must be classified
Not all structure changes behave the same way. Classification matters because probability changes with behavior.
Break in Market Structure (BMS)
BMS occurs when price first creates a fakeout and then breaks the opposing high or low. The fakeout is mandatory. If there is no fakeout, it is not BMS.
The fakeout represents liquidity. Traders are trapped, stops are hit, and orders are filled. Because of this, BMS often leads to fast and aggressive reversals.
If the price breaks the level directly after the fakeout, probability is higher. If price takes time before breaking, probability is lower. But as long as the fakeout exists, the structure change remains BMS.
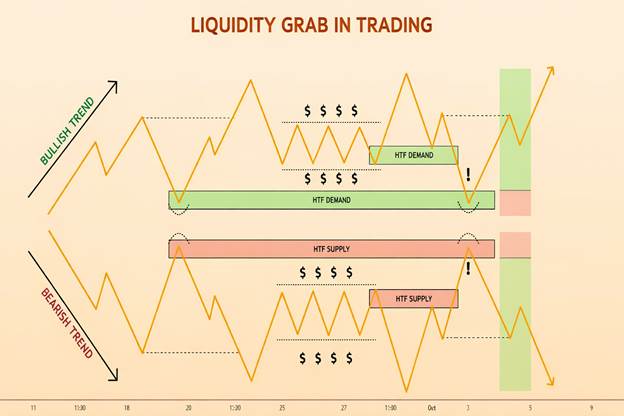
This image shows how BMS forms in real time. Price does not reverse randomly. First, it sweeps liquidity below structure, triggering stops and trapping traders on the wrong side.
That trapped liquidity allows price to reverse aggressively and break the opposing structure.
This is why BMS usually produces fast, decisive moves, not slow or gradual transitions.
Shift in Market Structure (SMS)
SMS occurs without a fakeout. Price changes direction gradually.
One structure break is not enough. Two consecutive structure breaks are required. The first break shows weakness. The second confirms that control has shifted.
SMS looks smooth and clean on the chart. However, because liquidity participation is not clearly visible, SMS generally carries lower probability.
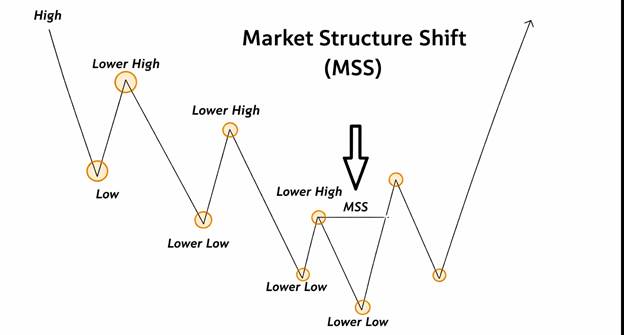
This image shows a Shift in Market Structure (SMS). Price weakens step by step. First, the trend loses momentum. Then a prior lower high is broken. Control shifts gradually from sellers to buyers.
There is no fakeout or liquidity grab here. That is why SMS looks clean but usually carries lower probability than BMS.
Fakeouts, Liquidity and Probability in Market Structure
Why fakeouts matter
Fakeouts are not manipulation. They are part of how markets function.
Large moves require liquidity. Fakeouts provide that liquidity by triggering stops and trapping traders on the wrong side of the market. This fuel allows price to move decisively.
This is why BMS is generally higher probability. The presence of trapped traders improves follow-through. SMS lacks this confirmation, which makes outcomes less reliable even though the move looks smooth.
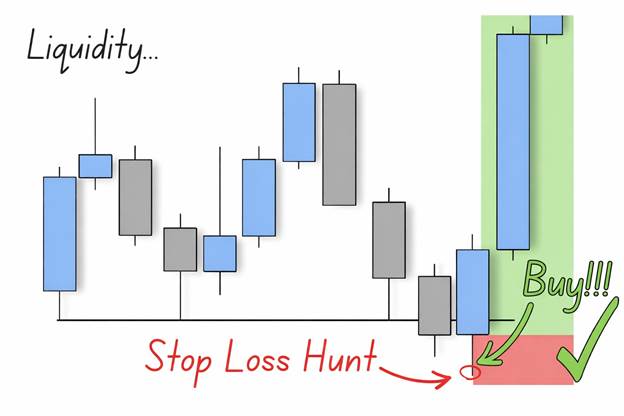
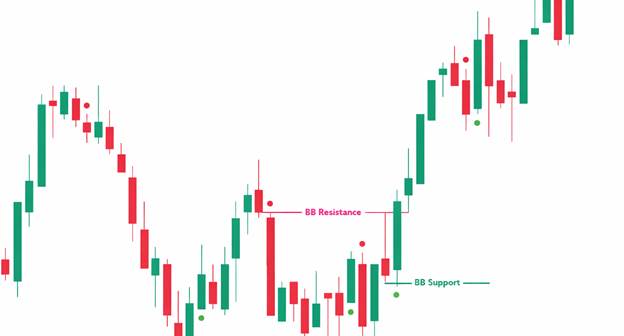
This image shows how liquidity drives price movement. Markets need orders to move.
Liquidity sits below obvious lows and above obvious highs.
Price moves into these areas to fill orders, not to trap traders emotionally. Stops provide the liquidity required for continuation. Without trapped traders, strong directional moves do not sustain.
When a Trend Actually Ends vs Pullbacks and Ranges
|
Situation |
What Price Is Doing |
What It Means Structurally |
What You Should Do |
|
Pullback |
Price retraces but main high or low remains intact |
Trend is still valid |
Do not assume reversal |
|
Minor swing break |
Small highs or lows are broken |
Noise, not structure change |
Ignore and stay patient |
|
Main high or low broken |
Key structure level fails |
Trend may be ending |
Reassess bias |
|
Shallow correction (<50%) |
Price corrects weakly |
No meaningful shift |
Do not force structure |
|
Deep correction (≈50% or more) |
Price corrects with depth |
Possible structure change |
Wait for confirmation |
|
Sideways market |
Equal highs and equal lows |
No directional control |
Reduce aggression or wait |
Market Structure as a Probability Framework (Trader Mindset)
What structure helps with and what it doesn’t
Trading is a numbers game. Market structure improves decision quality, not certainty.
It improves directional clarity, trade selection, and patience. It does not guarantee profits, call exact tops or bottoms, or replace execution and risk management.
Common mistakes include treating every BOS as a trend change, ignoring fakeouts, trading SMS setups as if they were BMS, and forcing structure where none exists.
This skill compounds slowly. With screen time and repetition, structure becomes intuitive. Over time, traders stop analyzing structure consciously and start recognizing it naturally.
Final Perspective
Market structure is not about predicting where price will go. It is about understanding what price is doing right now and whether that behavior makes sense to trade.
Trends continue until the main structure breaks. Pullbacks, fakeouts, and noise is part of normal market behavior. Sideways markets are not broken markets; they are balanced auctions.
BOS, BMS, and SMS are not setups. They are context tools. They help you decide when to be aggressive, when to be cautious, and when to stay out.
If structure is clear, execution becomes easier. If structure is unclear, patience is the trade. That’s the edge.
FAQs
1. How do traders avoid false trend reversals in market structure?
Traders avoid false reversals by waiting for the main structure high or low to break with confirmation, not reacting to pullbacks or minor swing breaks. Most false reversals occur when traders treat shallow corrections or wicks as trend changes instead of waiting for structural failure.
2. Why do breakouts fail so often in sideways markets?
Breakouts fail in sideways markets because price is in balance. Buyers and sellers agree on value, so price rotates instead of trending. Without imbalance or liquidity displacement, breakout attempts lack follow-through and quickly reverse.
3. Is market structure enough to trade without indicators?
Market structure alone can define direction, context, and invalidation, but it does not replace execution and risk management. Traders use structure to decide when not to trade as much as when to trade, which is where most consistency comes from.
Responses (0)
Leave a Reply
Your email address will not be published. Required fields are marked *
You might also like

Basics of Technical Analysis: A Beginner’s Guide to Reading Price, Charts and Candlesticks
Technical Analysis is the study of price charts to understand how buyers and sellers are behaving in the market. It is not about predicting prices or relying on indicators. Most beginners struggle not because charts are complex, but because they misinterpret what candlesticks, trends and patterns are actually showing. Technical analysis works across stocks, forex, crypto and commodities because human behavior drives all markets. This guide explains the basics of technical analysis in a clear, practical way, focusing on real price behavior, common beginner mistakes and how traders actually use charts to make informed decisions instead of guessing.

Market Trend Analysis Explained: Market Cycles, Accumulation and Distribution in Trading
Market trend analysis explains how price moves through structure, cycles and phases rather than predicting direction. Markets trend, pause, accumulate, distribute and repeat this process across all time frames. Trend analysis identifies whether price is making higher highs, lower lows, or compressing sideways, while market cycles explain why these structures form and reset. Accumulation and distribution occur inside consolidation, where institutions quietly build or exit positions before expansion or decline. When traders combine structural trend reading with market cycle awareness, they stop reacting to noise and start understanding where price is in the larger process.