Order Block Trading Strategy: What Is an Order Block and How to Trade It
Order block trading focuses on identifying the last area of buying or selling before price makes a strong move. An order block forms when large orders remain unfilled during rapid price movement, creating an area price often revisits to restore balance. Traders use order block trading by waiting for price to return to these zones, confirming context through momentum, liquidity sweeps and structure, then planning entries, stop loss and targets logically. When used with proper filtering and market context, order block trading helps traders avoid random setups and focus only on high-probability price areas.

What Is an Order Block? (Real Market Logic)
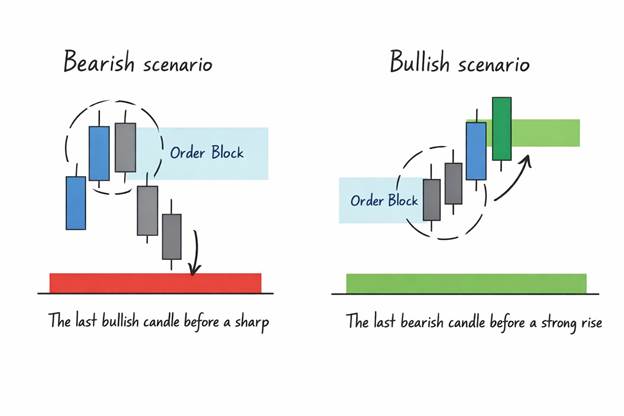
In order block trading, an order block is not a special candle or a zone you draw because price moved fast. It is the area where the market failed to stay efficient.
When price accelerates in one direction, large players cannot execute full positions in a single move. Some buying or selling remains incomplete. That unfinished activity creates imbalance. The market does not like imbalance. It tries to correct it.
This is why price often comes back to the same area it left from before the move. That return is not random. It is the market attempting to restore efficiency by filling unexecuted orders. An order block is simply that area of last buying or selling where liquidity was left behind and price is likely to react again.
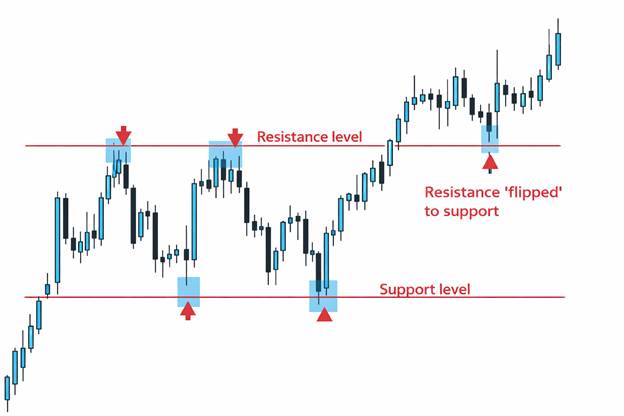
Example of price reacting at key support and resistance levels, showing how previous resistance flips into support after a successful break. These zones often align with areas of strong order flow and can act as reaction points when price returns.
Why Most Traders Get Order Blocks Wrong
Most traders lose money with order blocks for one simple reason. They mark too many of them. Every red candle before an up move starts looking like a bullish order block. Every green candle before a drop starts looking tradable. That is where the confusion begins.
Pattern Thinking vs Market Logic
An order block is not created just because the price changed direction. Random candles form all the time. Without strong momentum, without imbalance and without unfinished orders, those zones have no reason to hold. This is why many order block trading setups fail even though they look clean on the chart.
The biggest misunderstanding is treating order blocks as patterns instead of outcomes. Traders focus on how the candle looks, not on why price moved from that area. When liquidity, structure and context are ignored, order blocks stop working and start looking unreliable.
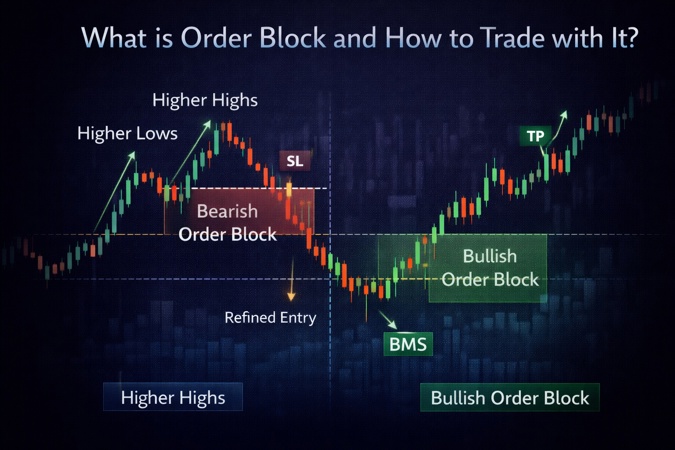
Bullish and Bearish Order Blocks Explained
Bullish Order Block:
A bullish order block forms at the last area of selling before price moves up with strength. This selling is not random. It is where sellers were present but could not push price lower and buyers absorbed that pressure. Once buying takes control, price leaves the area with momentum. That last selling zone becomes important because unfinished buy orders are still sitting there.
Bearish Order Block:
A bearish order block forms at the last area of buying before price drops aggressively. Buyers are active, but they fail to push price higher. Sellers step in with intent, price leaves the area fast and selling dominance becomes clear. That final buying zone is where incomplete sell orders remain.
Both bullish and bearish order blocks are identified the same way. You are not looking for candle color. You are looking for the last opposite activity before a strong move.
This becomes much clearer when you see it directly on the chart.
The chart showing bullish and bearish order blocks as the last opposite candles before a strong directional move. The highlighted zones mark areas where buying or selling activity was left unfinished, which often causes price to react when it revisits these levels.
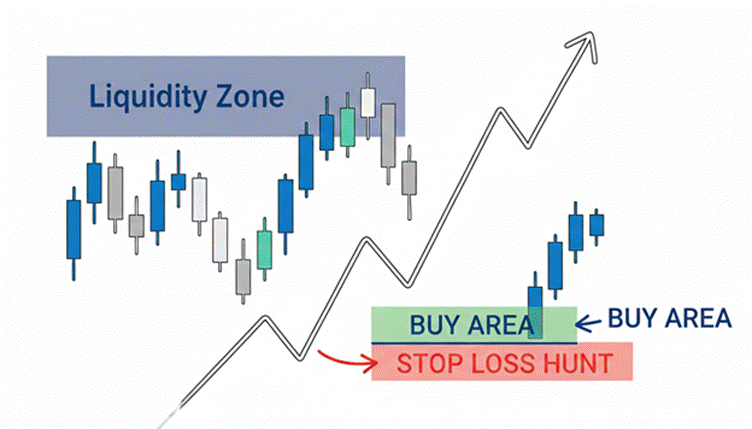
Why Price Returns to Order Blocks
Price does not return to an area because traders are waiting there. It returns because large orders were not completed the first time. Retail traders enter late and in small size. Institutions do not. They build positions gradually and fast moves prevent full execution.
Retests After Impulsive Moves
After a strong impulsive move, the market often leaves unfinished buying or selling behind. That imbalance pulls price back. This is why retests happen after expansion. Not to reverse the trend, but to complete pending orders.
This is the practical side of order block trading. When price revisits an order block, it is checking whether that area still holds liquidity. If the broader structure supports it, price reacts again. When it does not, the level fails. This is the difference between taking random order block trades and waiting for the ones that actually work.
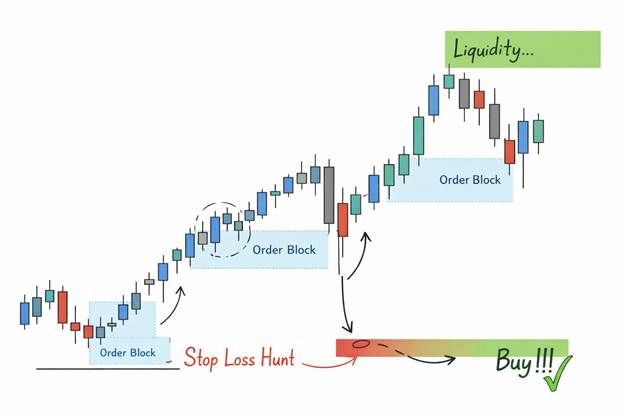
The chart shows price returning to an order block after a strong impulsive move, illustrating how the market revisits the zone to complete unfinished institutional orders rather than reverse the trend.
Types of Order Blocks Traders Must Know
Order blocks are not all the same. Some form in a single candle, others across multiple candles. What matters is whether the area marks the last real buying or selling before a strong move.
Single-Candle vs Multiple-Candle Order Blocks
Single-candle order blocks come from one final opposite candle before momentum. Multiple-candle order blocks form when that activity spreads over a small range. Both work only if intent is clear.
Primary vs Secondary Order Blocks
Primary order blocks form where the move actually starts and carry more weight. Secondary order blocks form during continuation and need confirmation. Some order blocks cause reversals, others support continuation. Identifying the type is what separates high-probability setups from random trades.
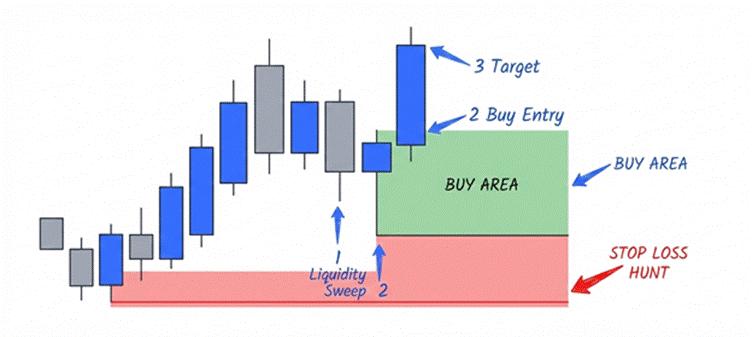
Liquidity sweep below support followed by a bullish reaction from the order block buy area.
This chart shows how a single-candle order block forms after a liquidity sweep. Price first takes out sell-side liquidity, then leaves the area with a strong bullish impulse, creating imbalance. The highlighted SCOB zone marks the last selling area before expansion, where unfilled buy orders remain. This is why price often reacts when it revisits this zone later.
How to Identify a Valid Order Block on the Chart
1. Look for momentum first
A valid order block stands out because price leaves the area with clear momentum. The move should be fast and decisive, showing urgency. If price drifts away slowly, there was no strong participation and no reason for price to respect that level again.
2. Check for liquidity involvement
Liquidity adds weight. When price first takes out stops through a liquidity sweep or fakeout and then moves with force, the order block formed after that move becomes meaningful. Weak hands are removed and stronger participants take control.
3.Confirm break of structure
Structure confirms the story. A break of structure after the move tells you the market has shifted. Without that break, the market is still balancing and reactions at the level become unreliable.
4. Validate location
Finally, location decides whether the setup is worth trading. A clean bullish order block in the wrong area often fails, just like a bearish order block formed in poor context. When momentum, liquidity, structure and location align, order block trading stops being random and starts offering clear, tradable opportunities.
This chart shows how price first collects liquidity, then moves aggressively, leaving an order block behind. The highlighted order block marks the last buying before the impulsive move. When price returns to this zone, it is revisiting unfilled institutional orders, not reacting randomly, before continuing in the main direction.
High Probability vs Low Probability Order Blocks
Not every order block deserves a trade. Many fail because traders ignore probability and treat all zones the same. Probability increases when an order block forms after a liquidity sweep. Stops are taken, weak traders exit and stronger players step in. That shift matters.
Location filters setups further. A bullish order block works best in discount areas. A bearish order block holds better in premium zones. When traded in the wrong location, even clean-looking zones fail.
Most order block trading losses come from skipping these filters. The solution is simple. Trade only those order blocks where liquidity is involved, location makes sense and context supports the move. That is how random setups turn into high probability order blocks.
How to Trade Order Blocks (Entry, Stop Loss and Target)
Single-Candle Order Block Execution
For a single-candle order block, entries are planned between the candle’s high and its midpoint. Stop loss sits below the swing for bullish setups and above it for bearish ones.
Multiple-Candle Order Block Execution
With multiple-candle order blocks, the zone is drawn using candle bodies, not wicks. Entries work best near the midpoint. Stop loss goes beyond the zone. Targets come from structure, not fixed ratios.
Final Perspective
Most losses come from the same mistakes. Traders mark too many zones, ignore liquidity and trade order blocks without structure or location. When every level looks tradable, discipline disappears. Order block trading works, but only when zones are filtered and traded with context, not hope.
This approach works across stocks, forex, crypto and indices. Higher timeframes offer cleaner structure, while lower timeframes demand precision. Timeframe matters less than execution quality. What actually improves results is screen time. Replay charts. Watch how the price reacts. That is where understanding develops.
Order blocks are not shortcuts. They are tools. Used patiently, they bring clarity. Used carelessly, they create confusion.
FAQs
- Does order block trading really work?
Yes. Order block trading works when trades are taken after liquidity is swept, structure is confirmed and the order block is in the right location. Without these conditions, results become inconsistent. - Which market is best for order block trading?
Order blocks work best in high-liquidity markets such as forex, crypto, indices and large-cap stocks where institutional participation is strong. - What timeframe is best for order blocks?
Order blocks work on all timeframes. Higher timeframes provide more reliability, while lower timeframes require precision and stronger confirmation. - Why do order blocks fail?
Order blocks fail when traders ignore liquidity sweeps, trade without structure confirmation, or take setups in the wrong market context.
Responses (0)
Leave a Reply
Your email address will not be published. Required fields are marked *
You might also like

Basics of Technical Analysis: A Beginner’s Guide to Reading Price, Charts and Candlesticks
Technical Analysis is the study of price charts to understand how buyers and sellers are behaving in the market. It is not about predicting prices or relying on indicators. Most beginners struggle not because charts are complex, but because they misinterpret what candlesticks, trends and patterns are actually showing. Technical analysis works across stocks, forex, crypto and commodities because human behavior drives all markets. This guide explains the basics of technical analysis in a clear, practical way, focusing on real price behavior, common beginner mistakes and how traders actually use charts to make informed decisions instead of guessing.

Market Trend Analysis Explained: Market Cycles, Accumulation and Distribution in Trading
Market trend analysis explains how price moves through structure, cycles and phases rather than predicting direction. Markets trend, pause, accumulate, distribute and repeat this process across all time frames. Trend analysis identifies whether price is making higher highs, lower lows, or compressing sideways, while market cycles explain why these structures form and reset. Accumulation and distribution occur inside consolidation, where institutions quietly build or exit positions before expansion or decline. When traders combine structural trend reading with market cycle awareness, they stop reacting to noise and start understanding where price is in the larger process.