Top Down Analysis Trading Using Smart Money Concepts
Top down analysis trading is about reading price from the highest timeframe first and using lower timeframes only to execute, not to decide. Markets move based on liquidity, structure, and dealing ranges, not indicators. When traders define the dealing range correctly, premium and discount zones become objective. Internal and external liquidity explain why price sweeps levels before expanding. This framework removes emotional bias, prevents random entries, and creates consistency across forex, crypto, and stocks by aligning execution with real market intent.

Top Down Analysis Trading: What It Really Means for Real Traders
Most traders misunderstand top down analysis trading because they treat it as nothing more than checking multiple timeframes and looking for agreement. In practice, this creates confusion because bias is formed on lower timeframes first and then emotionally justified using higher timeframes. The YouTube script makes it clear that this approach is flawed because lower timeframes carry less value and more noise.
Top down analysis trading actually means starting analysis from the highest relevant timeframe to understand market context, structure, and liquidity intent. The higher timeframe decides direction and narrative, while lower timeframes are used only to execute within that pre-defined story. When traders follow this order, analysis becomes structured, repeatable, and free from emotional bias caused by random lower timeframe signals.
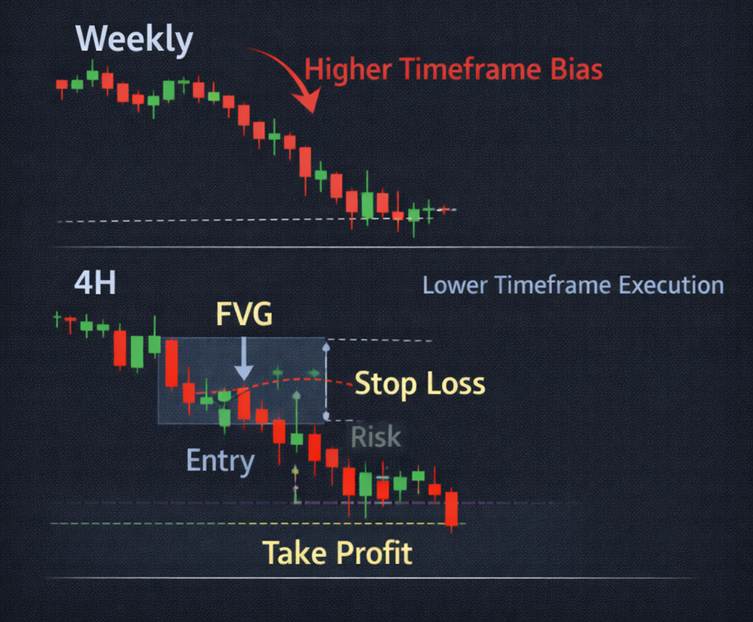
This image shows higher timeframe bias defining overall market direction while the lower timeframe is used strictly for execution. The structure demonstrates how context comes first, and entries are refined only after bias is established.
Why High Timeframe Bias Matters More Than Lower Timeframe Setups
Traders get trapped because they trust lower timeframe patterns without understanding higher timeframe intent. A clean setup on a small chart means nothing if the higher timeframe is in premium, discount, or distribution. This is where smart money concepts in trading actually matter, not at entry but at context.
Higher timeframes control direction. Lower timeframes only show execution noise. When traders reverse this order, losses feel random even when setups look perfect.
Top Down Market Structure Analysis: Reading BMS, SMS, and Fakeouts Correctly
Many traders misunderstand structure because they read it in isolation. A break on one timeframe can be a fakeout on another, and that is normal behavior, not contradiction. Top down market structure analysis works only when structure is read relative to timeframe importance.
If a higher timeframe shows BMS or SMS, that structure carries more weight than any lower timeframe breakout. Fakeouts happen when traders ignore this hierarchy and treat all breaks as equal.
How to Define a Dealing Range Using Liquidity, Not Random Highs and Lows
Most traders draw dealing ranges using random swing highs and lows, which is why their premium and discount zones fail. A real dealing range is defined by levels where external liquidity was swept or created. Those highs and lows matter because they represent real order absorption.
The dealing range is the zone where price is actively being traded right now. Without liquidity involvement, a high or low has no relevance in top down analysis trading.
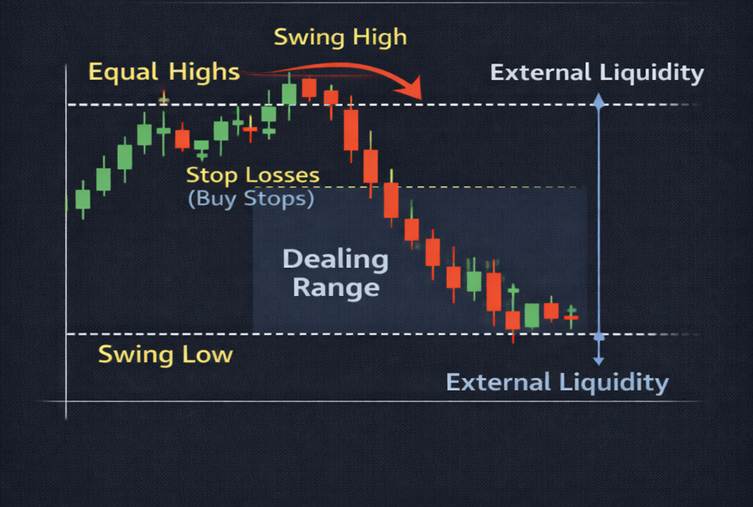
This chart illustrates a valid dealing range formed only after liquidity is swept. The swing high and swing low are defined by real order absorption, not random structure, creating an objective range for premium and discount analysis.
Premium and Discount Zones: Knowing When Price Is Expensive or Cheap
Traders lose money because they buy at a premium and sell at a discount without realizing it. Premium and discount zones exist to solve this exact problem. Once the dealing range is defined, price becomes objectively expensive or cheap.
In smart money concepts explained through execution, buying only makes sense in discount and selling only makes sense in premium. Everything else is low probability, no matter how good the setup looks.
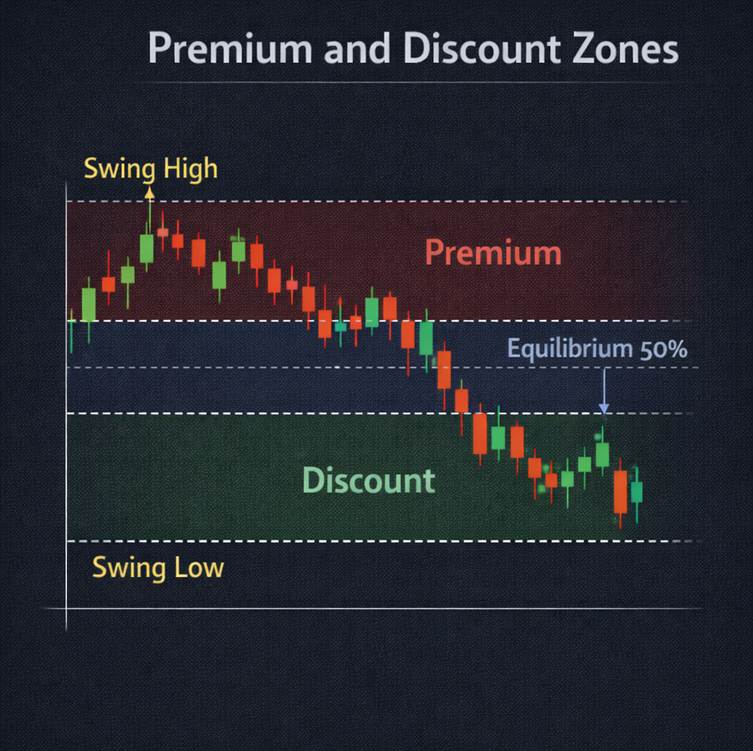
This image divides a confirmed dealing range into premium and discount zones using the 50% equilibrium level. Price above equilibrium is expensive, while price below is cheap, creating objective decision zones instead of emotional entries.
Internal and External Liquidity inside the Dealing Range
Inside every dealing range, price moves between internal and external liquidity pools. External liquidity exists at highs and lows, while internal liquidity forms through equal highs, equal lows, fair value gaps, and inefficiencies. Market structure and smart money concepts revolve around how price moves between these pools.
The price does not move randomly. It targets liquidity, absorbs it, and then moves away with momentum once orders are filled.
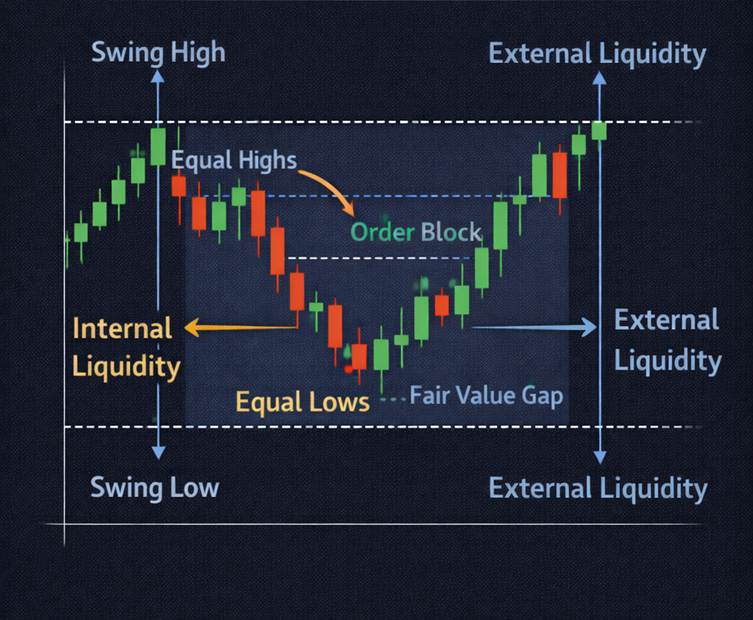
This chart highlights internal liquidity forming inside the range through equal highs, equal lows, and inefficiencies, while external liquidity rests beyond the range boundaries. It demonstrates how price rotates internally before expanding toward external liquidity targets.
How Smart Money Moves Price Between Liquidity Pools
Smart money cannot enter or exit without liquidity, so price is engineered to create it. This is why price sweeps highs or lows before making real moves. Traders often call this manipulation, but it is simply order execution at scale.
Understanding this behavior removes emotional reactions to stop hunts and fakeouts. Once liquidity is taken, direction becomes clear and movement accelerates.
Top Down Analysis Trading Execution: From HTF Bias to LTF Entry
Execution is where most traders break their own rules. Top down analysis trading execution starts with higher timeframe bias, then narrows into a smaller dealing range, and only then looks for entries. Lower timeframes are used to refine risk, not to change direction.
When higher timeframe context and lower timeframe execution align, trades become mechanical instead of emotional.
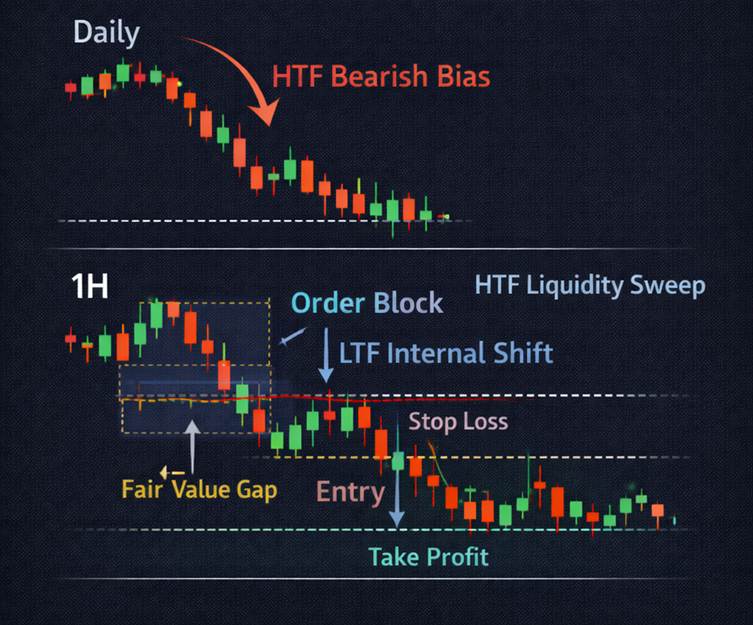
This image shows how higher timeframe bias guides direction, while the lower timeframe provides refined entries within liquidity zones. Execution aligns with structure, internal shifts, and inefficiencies without altering the original higher timeframe narrative.
Using Fair Value Gap, Breaker Block, and Structure inside the Top-Down Framework
Tools like fair value gap, breaker block, and structure only work when aligned with top down analysis price action. Used randomly, they fail. Used inside the correct dealing range, premium or discount zone, and liquidity context, they become precise execution tools.
Price action smart money concepts are not entry tricks. They are confirmations inside a pre-defined story built from higher timeframes.
Final Practical Workflow for Top-Down Analysis without Indicators
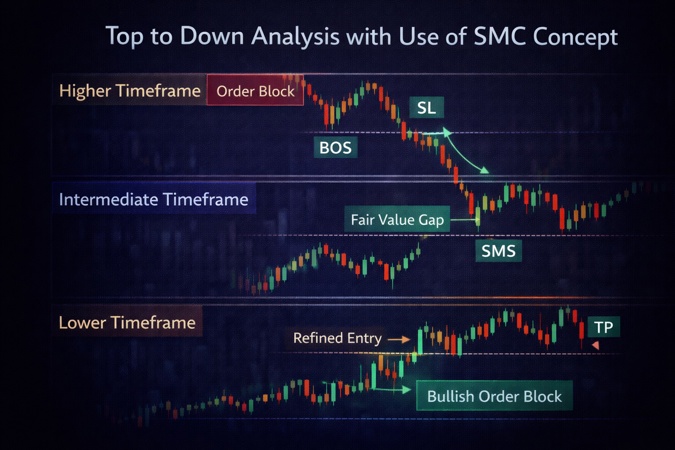
The workflow is simple but disciplined. First, take an overview of the chart using enough candles to understand market context. Second, define the dealing range using liquidity, not guesses. Third, identify premium and discount zones. Fourth, map internal liquidity. Finally, execute on lower timeframes without changing the story.
This is how top down technical analysis trading stays clean, repeatable, and usable on live charts.
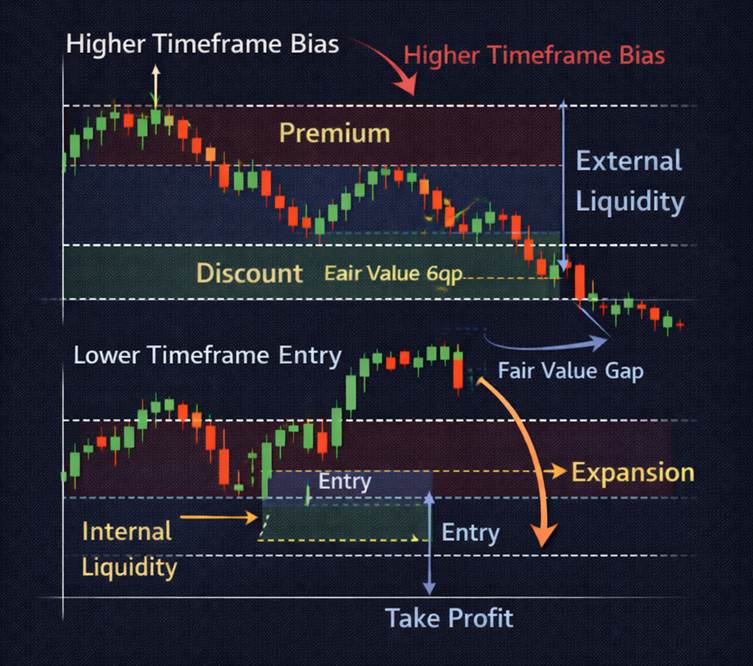
This visual combines the complete workflow: higher timeframe bias, liquidity-based dealing range, premium and discount zones, internal liquidity mapping, and lower timeframe execution. It demonstrates how structured analysis creates mechanical, repeatable trading decisions.
Top-Down Analysis Framework
|
Component |
Common Trader Mistake |
What Actually Works |
|
Higher Timeframe |
Used only for confirmation |
Defines real bias and intent |
|
Dealing Range |
Random swing selection |
Liquidity-based highs and lows |
|
Premium & Discount |
Subjective judgment |
Objective once range is fixed |
|
Liquidity |
Seen as manipulation |
Required for execution |
|
Lower Timeframe |
Used to decide direction |
Used only for entry |
Top-Down Analysis Checklist (Execution Focused)
Take a higher timeframe overview with sufficient candles.
Identify the active dealing range using liquidity sweeps.
Divide the range into premium and discount zones.
Read structure in context, not isolation.
Map internal and external liquidity.
Drop to lower timeframes only for execution.
Never change bias without higher timeframe confirmation.
FAQs
1. What is top down analysis trading in simple terms?
It means starting analysis from higher timeframes to define direction and liquidity, then using lower timeframes only to execute trades, not to decide bias.
2. Why is higher timeframe analysis more important than lower timeframe setups?
Higher timeframes show real market intent and liquidity. Lower timeframes mostly contain noise and false signals without higher timeframe context.
3. How does top down analysis reduce emotional trading?
Bias and levels are defined in advance on higher timeframes, so entries become rule-based instead of reactive or emotional.
4. What is a dealing range in smart money concepts?
A dealing range is the active price zone defined by liquidity sweeps and structure where price is currently being negotiated.
5. How do premium and discount zones work in top down analysis?
They show whether the price is expensive or cheap within the dealing range. Buy in discount, sell in premium for higher probability.
Responses (0)
Leave a Reply
Your email address will not be published. Required fields are marked *
You might also like

Basics of Technical Analysis: A Beginner’s Guide to Reading Price, Charts and Candlesticks
Technical Analysis is the study of price charts to understand how buyers and sellers are behaving in the market. It is not about predicting prices or relying on indicators. Most beginners struggle not because charts are complex, but because they misinterpret what candlesticks, trends and patterns are actually showing. Technical analysis works across stocks, forex, crypto and commodities because human behavior drives all markets. This guide explains the basics of technical analysis in a clear, practical way, focusing on real price behavior, common beginner mistakes and how traders actually use charts to make informed decisions instead of guessing.

Market Trend Analysis Explained: Market Cycles, Accumulation and Distribution in Trading
Market trend analysis explains how price moves through structure, cycles and phases rather than predicting direction. Markets trend, pause, accumulate, distribute and repeat this process across all time frames. Trend analysis identifies whether price is making higher highs, lower lows, or compressing sideways, while market cycles explain why these structures form and reset. Accumulation and distribution occur inside consolidation, where institutions quietly build or exit positions before expansion or decline. When traders combine structural trend reading with market cycle awareness, they stop reacting to noise and start understanding where price is in the larger process.