Breakout vs Fakeout: How to Identify Real vs False Breakouts in Trading
Breakout vs fakeout is one of the most confusing concepts in trading. Many traders struggle to identify whether a breakout is real or a false breakout. In this guide, you will learn how to identify breakout vs fakeout using price action, liquidity, and real market behavior.


What Breakout and Fakeout Really Mean in Professional Trading
Let's start by clearing a misunderstanding that ruins most breakout strategies.
Retail traders think a breakout means price crossing a line. A candle closes above resistance, the line is broken, job done. That is not how markets work.
From the market’s perspective, a breakout means acceptance. Acceptance means buyers and sellers are willing to transact beyond that level, not just spike through it. This is exactly why fakeout trading exists.
A fakeout is not manipulation. It is not the market trapping you personally. It is a functional move where price briefly crosses a level to trigger clustered stop losses and breakout entries so larger participants can execute their orders.
When you understand this, breakout trading stops being emotional and starts becoming mechanical.
Why Most Traders Misread Breakouts and Fakeouts
Most traders misread breakouts because they look for confirmation instead of context. A strong close feels convincing. High volume feels validating. Momentum indicators feel reassuring.
But none of these answer the only question that matters at that moment: what is price trying to do at this level?
Breakout vs fakeout confusion exists because the industry teaches patterns, not behavior. Before going further, this blog deliberately unlearns three ideas:
- A confirmed candle means safety.
- Fadeouts are rare accidents.
- More indicators mean better decisions
They don’t.
Markets reward patience, not certainty. This guide is written to help you read what price is doing after it reaches a level, not react when it touches one.
3 Possible Outcomes in Breakout vs Fakeout Trading
Whenever price reaches an important level, only three things can happen. There is no fourth outcome.
First, price breaks the level, retests it, and continues. This is the clean breakout everyone wants.
Second, price breaks the level, pulls back shallowly, and continues without a neat retest. This leaves disciplined traders behind and creates frustration.
Third, price breaks the level briefly and reverses sharply. This is the failed breakout - the fakeout.
Every breakout vs false breakout technical analysis scenario fits into one of these structures. Once you accept this, charts become simpler and decision-making becomes calmer.
Why Breakout vs Fakeout Can Never Be Known With 100% Certainty
This is the truth most trading courses avoid saying out loud.
You cannot know with certainty whether a breakout will hold or fail at the moment it happens. Not from candles. Not from indicators. Not even from experience.
Markets operate on probability, not prediction. Candles only describe what just happened. They do not tell you what still needs to happen.
Professional traders do not try to be right. They try to stay aligned with probability and manage risk when they are wrong. Once you accept this, you stop forcing trades and start waiting for information.
Liquidity and Smart Money: The Real Driver behind Breakouts and Fakeouts
Liquidity is the missing link in most breakout trading discussions. Liquidity simply means available orders.
Retail stop losses naturally sit:
- Above obvious highs
- Below obvious lows
This is not a mistake. It is human behaviour.
Institutions cannot execute large orders without counterpart liquidity. Fakeouts exist because they create that liquidity. When price briefly crosses a level, it triggers stop losses and breakout entries. Those orders become fuel.
Smart money is not hunting you. It does not care about your trade. It is responding to where liquidity already exists. When you understand this, fakeout trading stops feeling unfair and starts making sense.
The One Question That Separates a Real Breakout from a Fakeout
This is the question you should ask every single time price reaches a key level:
Where does price still need to go to access liquidity?
If liquidity above the level remains untouched, a breakout has purpose. If liquidity above has already been absorbed and liquidity below remains, a fakeout becomes more likely.
This is how experienced traders approach how to spot a real breakout vs fakeout in trading. They do not ask, “Did the candle close above?” They ask, “Is there unfinished business above or below?”
Price only moves toward imbalance. Once that imbalance is resolved, direction often changes.
Example: How to Identify Breakout or Fakeout in Live Price Action
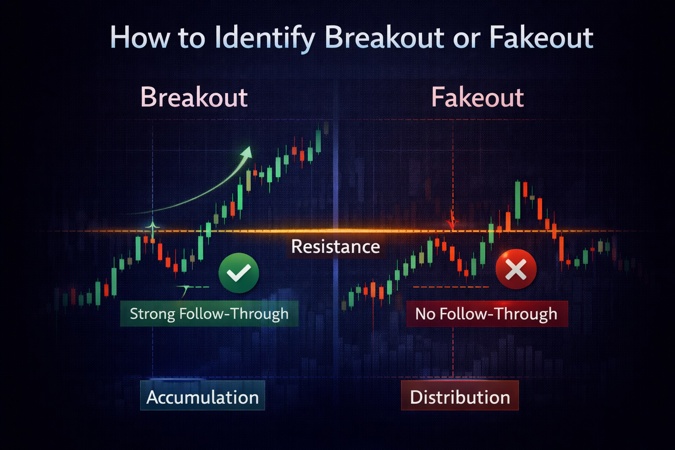
Assume price is approaching a clearly marked resistance level that has been respected multiple times.
Price pushes above the level and triggers breakout entries. At this moment, instead of entering immediately, observe the next candles.
If price continues to trade above the level and moves toward untouched highs where stop losses are still resting, the breakout has intent.
If price fails to find acceptance above the level, stalls, and closes back inside the range while liquidity below remains untouched, the move is likely a fakeout.
The decision is not made at the level, but after the market shows where it wants to take liquidity next.
Why Breakout Trading Fails Without Liquidity Context
Breakout trading fails most often at the most obvious levels, and this is not accidental.
When too many traders see the same breakout:
- Entries cluster
- Stops cluster
- Liquidity forms
Price often moves just far enough to trigger those orders and then reverses.
Emotional confirmation makes this worse. Once you convince yourself a breakout must work, objectivity disappears. Fakeouts punish certainty. They reward patience. This is why many breakout strategies fail - not because breakouts don’t work, but because context is ignored.
Rules, Frameworks and Their Limits in Breakout and Fakeout Trading
Rules are necessary, especially for beginners. But rules are filters, not truth.
A single candle can never confirm a breakout. A two-candle framework improves probability, not certainty. Swing failure and immediate fakeout logic help identify rejection, not guarantee reversal. Even the best fakeout strategy will fail sometimes.
Markets adapt. Context always overrides conditions. Professionals use rules to avoid bad trades, not to force good ones.
Conclusion
The difference between struggling traders and consistent ones is not intelligence. It is perception.
Beginners trade patterns. Professionals read behavior. Breakout vs false breakout technical analysis becomes clear when you stop asking what happened and start asking why it happened.
When you shift from indicators to intent, charts stop feeling noisy and start feeling purposeful.
Key Takeaways
- Breakouts and fakeouts are liquidity events, not candle patterns.
- Certainty is an illusion in real markets.
- Liquidity destination matters more than confirmation.
- Rules help, but context decides.
- Fakeouts are not traps, they are necessities.
- If you understand these principles, you do not need another article on breakout trading or fakeout trading. You need screen time, patience, and the discipline to keep reading the market instead of reacting to it.
FAQs
1. When should a trader enter after a suspected breakout?
Enter only after price shows acceptance or rejection beyond the level, never at the initial liquidity trigger.
2. Can a fakeout later become a real breakout at the same level?
Yes. After liquidity is taken, a later re-approach with fresh imbalance can produce a valid breakout.
3. Is breakout vs fakeout analysis different for intraday and swing trading?
No. The logic is identical; only the liquidity time frame changes, not price behavior.
4. Why do rule-based breakouts fail even when conditions look perfect?
Because rules show structure, not intent. If liquidity is already absorbed, breakouts often fail.
5. What should traders do when breakout and fakeout signals conflict?
Stand aside. Conflicting signals mean incomplete information, and waiting preserves capital.
Responses (0)
Leave a Reply
Your email address will not be published. Required fields are marked *
You might also like

Multiple Time Frame Analysis: A Practical Swing Trading Framework
This swing trading strategy is designed for traders who struggle with timing, not ideas. Most losses don’t come from missing opportunities, but from acting during the wrong phase of the market. This framework uses multiple time frame analysis to separate planning, confirmation, and execution into distinct steps, removing emotional decision-making during live markets.
Top 3 Chart Patterns in Trading You Must Know as a Beginner
Are trading charts going over your head? Then look no further - This guide will break down the top essential chart patterns in trading, signal market movements, practical strategies, risk management, and common mistakes to avoid as a beginner.