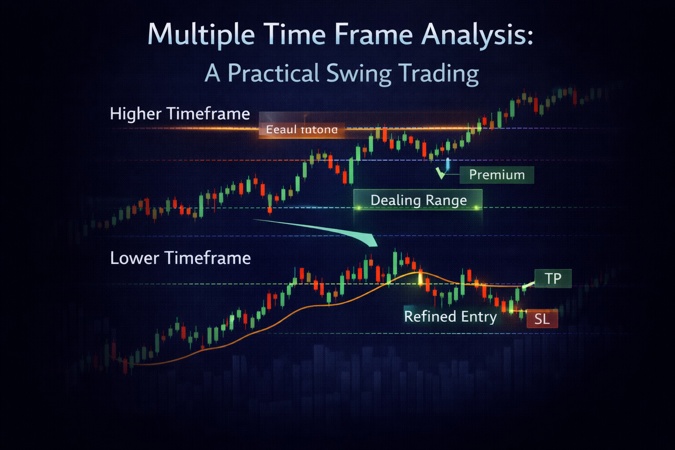
Multiple Time Frame Analysis: A Practical Swing Trading Framework
This swing trading strategy is designed for traders who struggle with timing, not ideas. Most losses don’t come from missing opportunities, but from acting during the wrong phase of the market. This framework uses multiple time frame analysis to separate planning, confirmation, and execution into distinct steps, removing emotional decision-making during live markets.


What This Strategy Is and Who It Is For
This strategy is built for traders who reach an uncomfortable realization early:
most losses don’t come from bad setups, they come from bad timing and emotional execution.
It works especially well for part-time traders, working professionals and swing traders who cannot sit in front of screens all day. In fact, excessive screen time actively harms performance in this framework. The goal is clarity, not activity.
At its core, this is a rule-based swing trading strategy designed around structure, behavior and timing rather than indicators or prediction. It accepts a market truth many traders resist: price moves in phases, not straight lines and most traders lose money by acting during the wrong phase.
If your goal is low-frequency, high-clarity execution with controlled risk, this approach fits naturally.
How the Strategy Works at a High Level
Experienced traders eventually internalize one principle:
price does not reward speed, it rewards positioning.
Most traders overanalyze because they believe more inputs create more certainty. In reality, additional signals dilute conviction and increase impulsive decisions. This framework deliberately limits decision points so that every action has a clear reason.
The structure follows a top down trading strategy:
- Higher time frames define context
- Mid time frames validate intent
- Lower time frames are used strictly for execution
Each layer has one responsibility. Nothing overlaps. Nothing is optional.
This is why multiple time frame analysis works when applied correctly. Noise is filtered before execution, not after damage is done.
The Rules That Govern This Strategy
This system operates on non-negotiables.
Core Rules
- Confirmation always comes before execution
- Market hours are for execution, not analysis
- No trade is better than a forced trade
Patience is not optional here - it is structurally enforced.
If a setup does not align across phases, it is ignored without hesitation.
That discipline is the difference between consistency and randomness.
The Three Time Frames Used and Their Purpose
This framework uses three fixed time frames. Adding more creates confusion, not clarity.
- Weekly defines market context
- Daily validates or rejects intent
- 15-minute handles execution
These are not arbitrary choices. They align with how larger participants evaluate price and how liquidity behaves around key levels. When traders ask about the best swing trading time frames, this combination consistently balances structure with practicality.
Knowing how to use multiple time frames in trading is less about stacking charts and more about assigning responsibility.
Multiple Time Frame Analysis: Swing Trading Strategy Framework
|
Phase |
Time Frame |
Trader’s Action |
Why It Matters |
|
Planning |
Weekly |
Mark previous week’s high and low |
Defines institutional context |
|
Waiting |
Daily |
Wait for fakeout and close back inside |
Confirms trap behavior |
|
Execution |
15-minute |
Enter after structure break |
Ensures confirmation |
|
Risk & Targets |
Structure-based |
Stop beyond structure, target next swing |
Enforces minimum 1:1 |
Phase 1: The Planning Phase (Weekend Preparation)
All meaningful work happens when markets are closed.
On the weekend, the weekly chart is opened for selected stocks or indices. One task is performed:
mark the previous week’s high and low. No indicators. No opinions. Just levels.
This phase removes emotional interference. You are not reacting to price. You are preparing reference points that institutions themselves respect.
Liquidity matters. Clean movement matters.
Ten prepared charts outperform fifty rushed ones.
This phase alone eliminates the majority of bad trades before they ever appear tempting.
Phase 2: The Waiting Phase (Daily Chart Confirmation)

This example shows why confirmation matters - price tests liquidity first, then reveals direction only after structure fails.
This is where most traders fail - not because it is complex, but because it is boring.
Price is allowed to interact with weekly levels. Nothing is done until a daily candle closes. Intraday movement is ignored entirely. Wicks matter. Closes matter more.
A valid setup forms only when price moves beyond a weekly level and fails to hold there by the daily close. That failure reveals intent.
If price accepts beyond the level, the market is not ready. You step aside.
This phase protects traders from emotional overtrading, the silent killer of most accounts.
Phase 3: The Execution Phase (15-Minute Chart Entry)
Execution happens on the 15-minute chart for one reason:
structure becomes visible without noise.
Once daily confirmation exists, a clear structure break is required. A meaningful swing high or swing low must be violated with acceptance, not just a wick.
Entries are taken on the break or on a shallow retest depending on risk.
Gap-up or gap-down opens are handled conservatively. If risk-to-reward degrades, the trade is skipped.
This is price action swing trading in its cleanest form.
No indicators. No guessing. Just response to evidence.
Stop-Loss, Targets and Risk-to-Reward Rules

This example highlights why confirmation and structure matter more than indicator signals alone.
Stops are placed where the idea becomes invalid, not where it feels comfortable.
Predictable stops become liquidity. This strategy avoids them by anchoring risk beyond structure, not near obvious levels.
Targets are defined using the next logical swing.
If the market does not offer at least a 1:1 risk-to-reward, the trade is rejected. No exceptions.
Trade management remains simple. Partial profits may be booked. Remaining positions trail structure. Complexity adds nothing here.
Real Market Examples and Practical Observations
Across stocks and indices, the behavior remains consistent. Outcomes vary week to week, but the logic does not.
Some trades complete in one session. Others take two or three days. Occasionally longer. That variability is normal.
Markets rotate between expansion and compression. This framework adapts by waiting rather than forcing alignment.
Process is trusted over outcomes.
Common Mistakes, Accuracy Boosters and Final Guidelines
The most common mistake is entering before daily confirmation.
The second is trading breakouts instead of traps.
Accuracy improves when higher-time-frame support or resistance aligns near execution zones. Confluence strengthens conviction but never overrides rules.
Backtesting is mandatory. Skill develops through repetition, not theory.
This strategy will frustrate traders who crave constant action.
For those seeking structure, clarity and control, it becomes a long-term edge.
Conclusion
Markets do not reward activity. They reward alignment across time frames.
This strategy works because it separates planning, waiting and execution through disciplined multiple time frame analysis. By removing decision-making during live market noise and enforcing confirmation, it replaces impulse with structure. Over time, that discipline compounds into consistency - the only edge that survives real markets.
Responses (0)
Leave a Reply
Your email address will not be published. Required fields are marked *
You might also like
Top 3 Chart Patterns in Trading You Must Know as a Beginner
Are trading charts going over your head? Then look no further - This guide will break down the top essential chart patterns in trading, signal market movements, practical strategies, risk management, and common mistakes to avoid as a beginner.

What Is Fair Value Gap (FVG) in Trading? Strategy, Examples & How It Works
A fair value gap (FVG) explains why price sometimes moves fast and later returns to the same area. It forms when price moves aggressively and skips proper order execution, creating an imbalance between buyers and sellers. This imbalance usually appears in a three-candle structure where the first and third candles do not overlap. Traders use this concept to understand where price is likely to react instead of guessing random reversals. A fair value gap trading strategy focuses on waiting for price to retrace into the gap after an impulsive move and then looking for confirmation, rather than chasing price. This approach helps traders trade with structure, patience, and clarity in real markets.