Volume Analysis Indicator: What It Really Means and How Traders Actually Use It
Volume in trading shows how many shares or contracts are traded within a specific timeframe, revealing real market participation behind price movement. A volume analysis indicator does not show buying versus selling pressure; it only measures how much trading activity occurred. When volume increases, it means more traders are entering the market, which often leads to higher volatility and stronger price moves. In volume analysis trading, traders mainly use volume to confirm breakouts, understand trend strength, and detect whether market interest is increasing or fading. Breakouts supported by rising volume have higher reliability, while moves with weak volume often fail or lose momentum quickly in active markets. Volume does not predict direction - it confirms conviction.


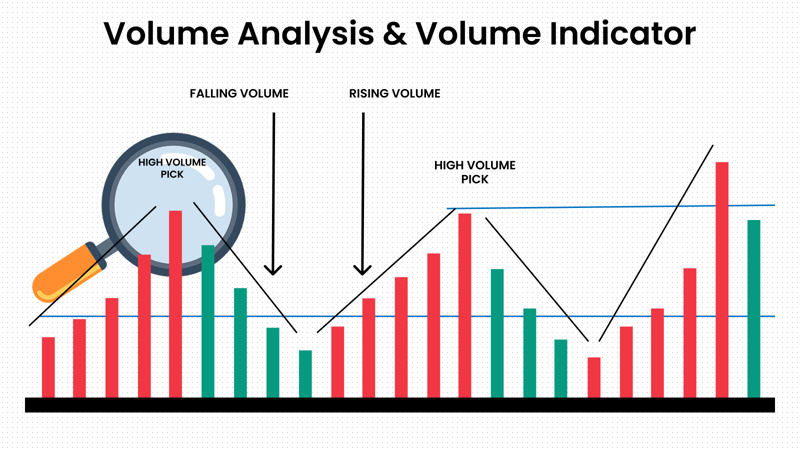
Volume Analysis Indicator: What Volume Actually Means on the Chart
Most traders misunderstand what volume actually represents on a chart. A common belief is that green bars mean buying pressure and red bars mean selling pressure. In reality, that interpretation is incorrect. Every buyer requires a seller, so buying and selling always occur in equal quantity.
A volume analysis indicator simply shows how many shares or contracts were traded during a specific timeframe. If 100 shares are traded between buyers and sellers, the total volume is 100, not 200. The indicator measures participation, not direction.
The height of the bars is what matters. Taller bars mean more shares were traded during that period, while shorter bars indicate lower participation. Once traders understand this correctly, volume-based analysis becomes far more practical and less confusing.
Volume Analysis Trading: Understanding Participation Behind Price Moves
When markets move quietly for long periods and suddenly show higher participation, something important is happening. A rise in trading activity means more market participants are entering the market.
This is where volume analysis trading becomes useful. If a stock has been trading with average volume for weeks and suddenly large bars start appearing, it means traders are paying attention to that asset again.
Higher participation often leads to higher volatility. When more traders start buying and selling actively, price movement naturally becomes faster. Observing this shift is a key part of price and market participation.
How to Use Volume in Trading to Detect Momentum and Volatility
A practical way to interpret volume is by comparing current bars with the average activity of previous candles. One simple approach is to use a moving average on the volume bars to see whether trading activity is increasing or decreasing.
When volume bars consistently move above their average level, it signals that market participation is expanding. This often happens before strong price movement begins.
This is the foundation of how to read volume in trading effectively without misinterpreting price direction.
Understanding how to use volume in trading is less about predicting direction and more about recognizing when the market is waking up. When participation increases, volatility tends to follow.
This behavior is why volume-based analysis is commonly used to monitor changes in momentum.
Volume Breakout Confirmation: Spotting Real vs Fake Breakouts
One of the most practical uses of volume is identifying whether a breakout is likely to succeed or fail. Breakouts that occur without increased participation often fail quickly.
When price breaks a consolidation level but volume remains low, it usually means not enough traders are involved. These situations frequently lead to fake breakouts.
However, if a breakout occurs and volume increases significantly, it suggests strong participation. In these cases the breakout is more likely to continue.
This concept is known as volume breakout confirmation, and it is one of the most reliable applications within volume analysis trading strategy approaches.
Volume Analysis Trading Strategy for Trade Entries
Volume should not be treated as a standalone signal. It works best as confirmation for setups already identified through price action or structure.
A simple volume-based analysis strategy is observing consolidation followed by increasing volume during a breakout. If price breaks a range while trading activity rises, it indicates growing market interest.
On the other hand, if a breakout happens with weak volume, the probability of failure increases. This is why experienced traders treat volume as an additional layer of confirmation rather than a trigger.
Over time, this approach becomes a practical form of volume indicator trading strategy that helps traders avoid low-participation moves.
Volume Divergence Trading: Identifying Weak vs Strong Trends
Volume can also reveal whether a trend has real participation behind it. If price is rising but trading activity continues to decline, it often indicates weak interest from market participants.
In contrast, when price moves in a direction and volume increases at the same time, the trend tends to be stronger.
This idea is commonly described as volume divergence trading. When price and participation move together, the trend has support. When price moves alone, the trend may lack conviction.
Although some traders analyze this deeply, many professionals use it only as context within broader market participation decisions.
Conclusion
The most practical takeaway is simple. Volume tells you when traders are paying attention to the market.
When participation increases, volatility often follows. When participation remains low, markets tend to stay quiet.
For most active traders, volume-based analysis is used mainly to confirm breakouts, detect increased market interest, and recognize when volatility may expand.
The goal is not prediction. The goal is understanding when market activity is strong enough to support a move.
Volume does not tell you what will happen next - it tells you how strong the market conviction is right now.
FAQs
1. What does a volume analysis indicator show in trading?
A volume analysis indicator shows the number of shares or contracts traded during a specific timeframe. It measures market participation, not buying or selling pressure. Higher volume bars indicate more traders are active in the market.
2. How is volume analysis trading used in technical analysis?
Volume analysis trading helps traders understand participation behind price movement. When volume increases during breakouts or trends, it often indicates stronger market interest and higher probability of continuation.
3. Why is volume important during breakouts?
Volume helps confirm whether a breakout is genuine. Breakouts that occur with rising trading activity usually have stronger momentum, while low-volume breakouts often fail.
4. What is volume divergence in trading?
Volume divergence trading occurs when price moves in one direction but volume moves in the opposite direction. This can signal weakening participation and a possible slowdown in the trend.
5. Can volume be manipulated in markets?
Volume is difficult to manipulate because it represents the actual number of shares or contracts traded. Large increases in volume typically reflect genuine participation from market participants.
Responses (0)
Leave a Reply
Your email address will not be published. Required fields are marked *
You might also like

Multiple Time Frame Analysis: A Practical Swing Trading Framework
This swing trading strategy is designed for traders who struggle with timing, not ideas. Most losses don’t come from missing opportunities, but from acting during the wrong phase of the market. This framework uses multiple time frame analysis to separate planning, confirmation, and execution into distinct steps, removing emotional decision-making during live markets.
Top 3 Chart Patterns in Trading You Must Know as a Beginner
Are trading charts going over your head? Then look no further - This guide will break down the top essential chart patterns in trading, signal market movements, practical strategies, risk management, and common mistakes to avoid as a beginner.