Bollinger Bands Indicator: What It Is and How to Trade With It
The Bollinger Bands indicator is a technical tool that helps traders understand how far price moves from its recent average. It consists of three lines: a middle moving average, an upper band, and a lower band. Price usually trades within these bands, showing how far it has expanded from its mean. Instead of treating the bands as fixed support or resistance, traders use them as dynamic zones to understand price extremes. A common approach is waiting for structures like double tops or double bottoms near the bands and entering only after a neckline break. This method focuses on confirmation, helping traders plan entries, stop loss, and targets with more structure.


Bollinger Bands Indicator: What It Is and Why Traders Use It
Many traders first encounter the Bollinger Bands indicator and immediately assume it is a signal generator. Price touches the upper band so they short. Price touches the lower band so they buy. That approach creates confusion because markets do not behave that mechanically.
The indicator was created by John Bollinger and simply forms a band around price. Price trades inside that band most of the time. In practical trading terms, it becomes a visual framework showing where price is stretched and where it is closer to its average. That is why many traders search for Bollinger Bands explained before applying it in real charts.
Bollinger Bands do not predict direction - they show relative price expansion from the average.
The main advantage is simple. Instead of drawing static levels manually, the bands automatically show zones where price often reacts. That is why the Bollinger Bands technical indicator is widely used across crypto, stocks, and intraday markets.
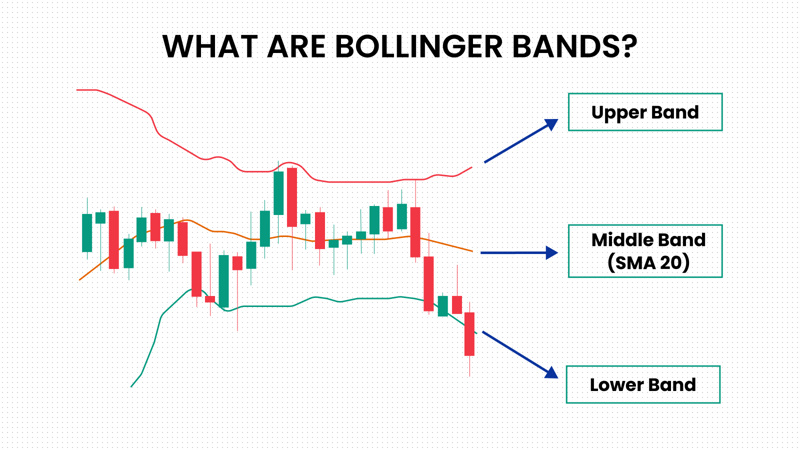
Understanding the Upper Band, Lower Band, and Moving Average
Once the indicator is applied on a chart, three lines appear around price. The center line represents the moving average, while the upper and lower lines form the outer range.
The middle line acts as the average price of recent candles. The upper band sits above that average and the lower band sits below it. Together they create a moving range where price usually fluctuates. This is why traders often describe the indicator as a Bollinger Bands volatility indicator, because the bands expand and contract depending on market activity.
In practice, the upper band behaves like resistance and the lower band behaves like support most of the time. This is why traders frequently treat them as Bollinger Bands support and resistance zones that move with price rather than staying fixed on the chart.
Indicator Settings: Why 20 Moving Average and 2 Standard Deviation Matter
Most traders do not change the default settings of the indicator, and there is a reason for that. The common configuration uses a 20-period moving average and two standard deviations.
In simple terms, this setting creates a range where price tends to remain most of the time. If you widen the deviation too much, the bands move too far away from price and lose practical value. If the deviation becomes too small, the bands become too tight and generate too many signals.
Using the default configuration keeps the structure balanced. The middle line reflects the average of the last twenty candles, while the outer bands measure how far price is moving away from that average. This is the basic framework behind how the indicator functions on a chart.
How to Use Bollinger Bands in Trading Without the Common Beginner Mistake
A common misunderstanding appears when traders first learn how to use Bollinger Bands in trading. Many believe every touch of the upper band should be shorted and every touch of the lower band should be bought.
In reality, price can continue moving along the band. When markets trend strongly, candles often walk along the upper or lower edge instead of reversing immediately. That is why simply reacting to band touches usually leads to poor trades.
The correct approach is to treat the bands as context rather than direct signals. This is the foundation of how to use Bollinger Bands correctly - not as entry signals, but as a framework to read where price is stretched or compressed. This indicator helps identify areas where price is stretched relative to its average, but the actual trade decision should depend on market structure.
How the Bands Work as Dynamic Support and Resistance
One reason traders rely on this tool is its ability to highlight moving reaction levels. The upper band frequently behaves like resistance while the lower band behaves like support.
Unlike static levels drawn manually, these zones move with price as the market evolves. That is why traders often refer to them as Bollinger Bands support and resistance.
When price moves toward the upper band, the market is trading above its average range. When price approaches the lower band, the market is trading below that average range. This dynamic structure is one of the reasons the indicator remains widely used in different markets and timeframes.
Bollinger Bands Trading Strategy: Double Bottom and Double Top Setup
Among the many approaches available, one of the most practical methods is the Bollinger Bands trading strategy built around double bottoms and double tops.
Instead of reacting to the first touch of a band, the strategy focuses on a structure forming near the outer edge. In a bullish setup, price pushes outside the lower band and then forms a double bottom pattern. In a bearish scenario, price moves beyond the upper band and forms a double top structure.
These formations often appear in Bollinger Bands reversal strategy setups because they show price attempting to break a level but failing to maintain momentum. These formations highlight failed expansion. Price attempts to move beyond the band but cannot sustain it, which often leads to a structure-based reversal.
Intraday Setup: Identifying the W and M Market Structure
For shorter timeframes, the setup usually appears as a W pattern for bullish reversals or an M pattern for bearish reversals. This structure is commonly traded as part of a Bollinger Bands intraday strategy.
The sequence is straightforward. Price first moves outside the band, creating the initial push. After that, the market forms a swing high or swing low and begins forming the second leg of the pattern.
When the neckline of that structure breaks, traders consider the market structure shifted. At that moment the trade setup becomes valid.
Entry, Stop Loss, and 1:1 Target Framework for the Strategy
The entry occurs when price breaks the neckline of the W or M structure. That break confirms the shift in market structure.
Without a structure break, the pattern is incomplete — and no trade should be taken.
Breakouts become more reliable when market participation increases, as stronger activity supports the move.
The stop loss is typically placed slightly beyond the recent swing low or swing high to avoid premature exits caused by minor volatility. The first target is usually set using a 1:1 distance relative to the structure’s depth.
Many traders also extend the trade toward the origin of the previous move. This creates a second target and improves the overall risk-to-reward structure. Real chart observations like these often appear in a Bollinger Bands trading example, where partial profits are taken at the first target while the rest of the position runs toward the second.
Improving the Setup Using RSI Confirmation (Bonus Filter)
Although the strategy can work independently, an additional confirmation can improve probability. Some traders combine the band setup with RSI divergence.
When price forms a double bottom near the lower band while RSI shows divergence, the setup becomes stronger. Similarly, when price forms a double top near the upper band with RSI divergence, it strengthens the bearish case.
This does not replace the Bollinger Bands trading strategy, but it acts as an additional filter that can increase confidence in the setup. This does not replace structure. It only adds confirmation when momentum and price behavior align.
Conclusion
The Bollinger Bands indicator is not designed to predict direction. Its real purpose is to show where price is trading relative to its recent average.
When traders stop treating it as a signal generator and instead use it as context for market structure, the indicator becomes far more practical.
Combined with patterns like double tops and double bottoms, it helps identify areas where price expansion fails and structure begins to shift.
Like any trading method, results come from consistent observation and disciplined execution on real charts.
Trade structure, not band touches.
FAQs
1. What is the Bollinger Bands indicator in trading?
The Bollinger Bands indicator is a technical tool that places two bands around a moving average. These bands show how far price moves from its average and help traders understand volatility and potential support or resistance zones.
2. How do traders use Bollinger Bands in trading?
Traders observe how price reacts near the upper and lower bands. The upper band indicates relatively extended price levels, while the lower band shows relatively lower price levels, helping traders analyze possible entries with market structure.
3. What are the best Bollinger Bands settings for trading?
The most common Bollinger Bands settings use a 20-period moving average with two standard deviations. These default settings provide a balanced range that works well across most markets and timeframes.
4. Do Bollinger Bands work for intraday trading?
Yes, Bollinger Bands are widely used in intraday trading. Traders apply them on short timeframes like 1-minute or 5-minute charts to identify volatility changes, breakouts, and possible reversal setups.
5. Are Bollinger Bands good for beginners?
Bollinger Bands can help beginners visualize volatility and dynamic support or resistance. However, traders should combine them with price structure and risk management rather than relying on band touches alone.
Responses (0)
Leave a Reply
Your email address will not be published. Required fields are marked *
You might also like

Multiple Time Frame Analysis: A Practical Swing Trading Framework
This swing trading strategy is designed for traders who struggle with timing, not ideas. Most losses don’t come from missing opportunities, but from acting during the wrong phase of the market. This framework uses multiple time frame analysis to separate planning, confirmation, and execution into distinct steps, removing emotional decision-making during live markets.
Top 3 Chart Patterns in Trading You Must Know as a Beginner
Are trading charts going over your head? Then look no further - This guide will break down the top essential chart patterns in trading, signal market movements, practical strategies, risk management, and common mistakes to avoid as a beginner.