RSI Divergence Scalping Strategy for Short-Term Trading
RSI divergence helps short-term traders identify momentum exhaustion, not predict reversals. The RSI indicator measures momentum strength, and divergence appears when price continues moving but momentum fails to confirm it. This mismatch often signals slowing pressure before short-term price reactions. Used on 1-minute and 5-minute charts with simple RSI settings, RSI divergence works best when combined with market structure and disciplined risk management. It should not be traded as a standalone signal or during strong one-directional trends.


Introduction: Why RSI Divergence Works
Most traders struggle because indicators are taught as signals instead of tools. Charts get overloaded, decisions become reactive, and trades feel random. RSI divergence brings clarity because it focuses on momentum behavior, not prediction.
In short-term trading, where decisions must be fast and logical, understanding momentum exhaustion matters more than stacking indicators.
What RSI Really Measures

Image showing how the RSI indicator oscillates between overbought and oversold levels to reflect momentum strength.
The Relative Strength Index (RSI) is a momentum indicator available on charting platforms like TradingView. It measures the strength and speed of recent price movements, not price direction. RSI is plotted below the main price chart and helps traders understand whether momentum is strengthening or weakening.
Instead of showing price directly, RSI converts recent gains and losses into a value between 0 and 100, giving traders a simple way to observe momentum behavior and potential exhaustion in the market.
It compares recent gains to recent losses to measure how strongly price is moving at a given moment. This is where most traders misinterpret the indicator.
RSI is not a signal to buy when it is low or sell when it is high.
That interpretation ignores how markets actually move. RSI only shows whether momentum is strengthening or weakening, not whether price must reverse.
How RSI should be used
RSI should be used to observe momentum behavior, not to predict reversals. When RSI begins to lose strength while price continues moving, it provides information about momentum exhaustion, which becomes meaningful when combined with price structure.
When treated as a momentum tool, RSI becomes useful. When treated as a reversal switch, it fails.
What RSI Divergence Actually Means
RSI divergence appears when price and momentum stop agreeing.
- Price continues moving
- Momentum fails to confirm that move
This disagreement signals that the current move is losing strength. In short-term markets, momentum often weakens before price reacts. RSI divergence does not predict reversals. It highlights areas of potential exhaustion, which is exactly what short-term traders need.
How RSI Divergence Works in Trading

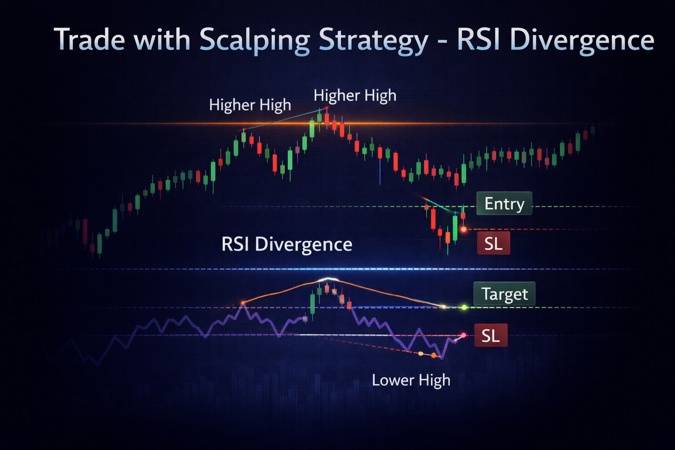
Conceptual image showing how RSI divergence reflects momentum weakening in both bullish and bearish contexts. Divergence should be evaluated with market structure, not memorized as fixed patterns.
A RSI Divergence Scalping Strategy focuses on short timeframes, mainly the 1-minute and 5-minute charts. These timeframes respond quickly to momentum changes.
RSI settings should remain simple. Constant tweaking creates inconsistency and confusion.
Divergence works well for scalping because:
- Momentum shifts first
- Price reacts later
- Short-term reactions matter more than predictions
The goal is not to catch big moves. The goal is to trade moments where momentum weakens and price becomes vulnerable to reaction.
Bullish vs Bearish Divergence Logic
The logic remains the same on both sides of the market.
- In bullish conditions, price makes lower lows while momentum fails to follow
- In bearish conditions, price makes higher highs while momentum weakens
What matters is context, not the signal itself.
RSI divergence works best near:
- Prior highs or lows
- Consolidation zones
- Areas where price has already slowed
This is not about perfect entries. It is about aligning market structure and momentum behavior to improve probability.
Why Most Traders Fail With RSI Divergence
Most traders fail because they treat divergence as a standalone signal.
Common mistakes include:
- Trading every divergence blindly
- Ignoring overall price behavior
- Obsessing over risk-to-reward while ignoring consistency
Strong trends can continue even when momentum slows. When traders ignore context, RSI divergence becomes unreliable.
Risk Management for Scalping
Risk-to-reward alone does not create profitability.
A strategy with a high reward but poor consistency still loses over time. In RSI divergence scalping, risk management is about:
- Controlled losses
- Repeatable execution
- Stable decision-making
When risk, win rate, and execution are balanced, results improve without emotional pressure.
When to Use RSI Divergence (and When Not To)
RSI divergence works best in liquid, short-term markets where price frequently pauses and reacts. It performs well when momentum changes are respected.
It should be avoided during strong, one-directional trends where momentum remains firm.
Used selectively and logically, the RSI Divergence Scalping Strategy simplifies trading instead of complicating it.
Final Thoughts
RSI divergence is not a shortcut and it is not a prediction tool. It is a way to understand when momentum is no longer supporting price. In short-term trading, that information is valuable because price reactions often begin after momentum weakens.
Used with market structure and context, RSI divergence helps traders simplify decisions instead of adding more indicators. Used blindly, it creates confusion. The difference lies in how it is applied.
If the goal is consistency rather than excitement, the RSI Divergence Scalping Strategy works best when treated as a contextual tool, not a standalone signal.
FAQs
1. Can RSI divergence be used on its own for trading decisions?
RSI divergence should not be used on its own. It works best when combined with price structure, market context, and disciplined risk management.
2. Why does RSI divergence appear frequently but work inconsistently?
RSI divergence appears often because momentum shifts regularly. It works inconsistently when traders ignore context and trade every signal without confirmation from price behavior.
3. Is RSI divergence suitable for beginners in scalping?
Beginners can use RSI divergence if they focus on understanding momentum and structure rather than treating it as a buy or sell signal.
4. Can RSI divergence be applied to markets other than stocks?
Yes, RSI divergence can be applied to any liquid market where momentum behavior is visible, including indices, forex, and crypto.
5. What should a trader look for before trusting RSI divergence?
Before trusting RSI divergence, traders should assess market structure, trend strength, and whether price is already showing signs of slowing.
Responses (0)
Leave a Reply
Your email address will not be published. Required fields are marked *
You might also like

Multiple Time Frame Analysis: A Practical Swing Trading Framework
This swing trading strategy is designed for traders who struggle with timing, not ideas. Most losses don’t come from missing opportunities, but from acting during the wrong phase of the market. This framework uses multiple time frame analysis to separate planning, confirmation, and execution into distinct steps, removing emotional decision-making during live markets.
Top 3 Chart Patterns in Trading You Must Know as a Beginner
Are trading charts going over your head? Then look no further - This guide will break down the top essential chart patterns in trading, signal market movements, practical strategies, risk management, and common mistakes to avoid as a beginner.