Fibonacci Retracement Strategy: What It Is and How to Use It
Fibonacci in trading is a mathematical tool that measures how much price retraces inside a defined range between a swing high and swing low. It divides that range into percentage levels like 50%, 61.8%, and 78.6% to identify equilibrium, cheap, and expensive areas. The core idea is simple: buy below 50% where price is cheaper and look for stronger reactions inside the 61.8%–78.6% golden zone. Always draw it from confirmed swings and left to right. A proper Fibonacci trading strategy focuses on range, location, and disciplined execution, not blind entries or prediction. It helps traders trade structure instead of emotion. This is how to use Fibonacci retracement in trading as a structured decision-making tool instead of a prediction tool.


What Is Fibonacci Retracement in Trading and Why It Matters
Most traders use tools without knowing why they exist. That is why they lose confidence when a level fails. So before using anything, you need clarity on what is Fibonacci retracement and why it is even on your chart.
Fibonacci comes from a mathematical series where each number is created by adding the previous two. As the sequence grows, dividing numbers gives a constant ratio around 1.618. That number is called Phi, or the golden ratio. This ratio appears in mathematics, nature, architecture, and proportion. Trading is also a numbers game, so it is not random that Fibonacci levels in trading are derived from this logic.
These levels are not magical. They are percentage divisions of a price range. When markets move from a swing low to a swing high, the retracement inside that range can be measured mathematically. That measurement is what traders call Fibonacci retracement.
Fibonacci Trading Strategy: Understanding Range, Retracement, and Correction
Most confusion begins because traders do not define range properly. Without range, no level makes sense. A Fibonacci trading strategy always starts with identifying a clear swing high and swing low. That distance between them is the range.
When price moves up and then pulls back, that pullback is called retracement or correction. What traders usually misunderstand is they try to guess how deep the correction will go. Instead of guessing, measure it. That is where the Fibonacci trading strategy becomes practical.
When price falls from a high, Fibonacci simply tells you how many percent it has retraced inside that range. If price moves from 100 to 200 and comes back to 150, it has retraced 50 percent. Markets respect percentage-based pullbacks because price naturally expands and contracts within defined ranges. You are not predicting direction. You are measuring behavior.
Fibonacci Levels in Trading: 23.6%, 38.2%, 50%, 61.8%, 78.6% Explained
Traders often treat all levels equally. That is a mistake. The most important idea inside Fibonacci levels in trading is equilibrium.
The 50% level is equilibrium. It divides the entire range into two halves. Above 50% is expensive. Below 50% is cheap. This cheap vs expensive logic is practical, not theoretical. If price is above equilibrium inside a range, buying becomes less favorable. If price is below equilibrium, buying becomes more logical.
The 61.8% level comes directly from the golden ratio. Dividing 1 by 1.618 gives approximately 0.618. That is why it carries weight. The 78.6% level comes from the square root of 0.618. These are not random numbers. They are derived from the same mathematical structure.
These best Fibonacci retracement levels act as support when price pulls back in an uptrend and resistance when price retraces in a downtrend. But levels alone are not trades. They are areas of interest.
How to Draw Fibonacci Retracement Correctly (Left to Right Rule)
Most traders lose money because they draw it incorrectly. If you do not know how to draw Fibonacci retracement, everything else becomes useless.
Rule one: always draw from confirmed swing high and swing low. Never draw on active candles. If the swing is not complete, the range is not defined.
Rule two: always draw left to right. Do not overcomplicate with uptrend or downtrend confusion. Just check what is on the left. If swing low is on the left, click there first. If swing high is on the left, click there first. Then drag to the right side of the range.
This single rule removes most drawing errors inside Fibonacci retracement trading strategy.
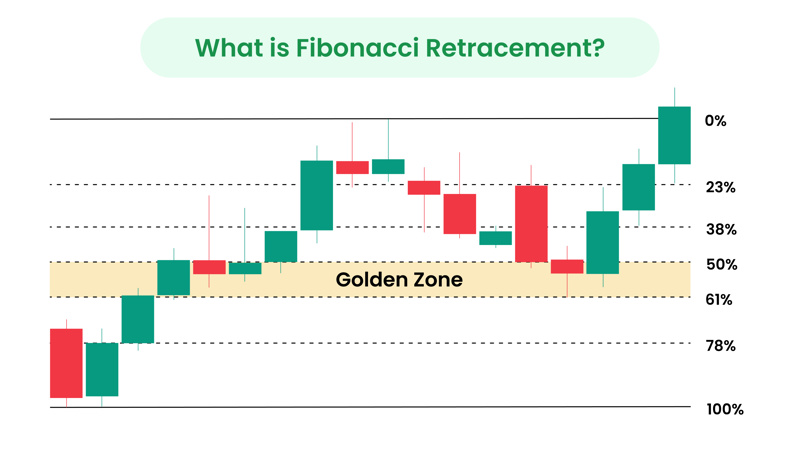
Fibonacci Golden Zone Trading: Where High-Probability Entries Form
Many traders try to trade every level. That creates confusion. In practice, the 61.8% to 78.6% area is where stronger reactions often occur. This area is called the golden zone.
In Fibonacci golden zone trading, if price retraces below 50% and enters 61.8%–78.6%, it becomes a better buying zone in an uptrend. In a downtrend, when price retraces above 50% and enters that same zone from below, it becomes a better selling area.
This does not mean blindly entering. The script clearly emphasizes that any strategy—EMA, RSI, or other setups—works better when aligned inside this zone. That is how to use Fibonacci retracement practically. It filters entries by location.
Fibonacci Trading Strategy for Entries: Cheap Buy, Expensive Sell
Here is where traders overcomplicate things. The logic is simple. In a range, buy cheap and sell expensive. That is the core of a Fibonacci trading strategy.
If price is above 50%, it is expensive relative to that range. If price is below 50%, it is cheap. Instead of buying everywhere, wait for price to enter cheap territory.
The script also shows removing unnecessary levels like 23.6% and 38.2% to reduce noise. By keeping 50%, 61.8%, and 78.6%, you simplify decision-making. This filtering makes the Fibonacci trading strategy cleaner and more mechanical.
Invalidation is also clear. If price breaks the defined range high or low, your bias was wrong. That level becomes your reference.
Fibonacci Pullback Trading Example on Live Chart
Theory means nothing without charts. In a Fibonacci retracement example shown in the script, price moved from a defined high to low, retraced into the golden zone, and then continued downward. That reaction occurred near 78.6%.
In another Fibonacci pullback trading scenario, price moved up, retraced to 50% or slightly below, and then continued higher. The reaction respected equilibrium and cheap pricing.
The lesson is not that every level holds. The lesson is that reactions cluster around defined percentage areas inside a range. That is how Fibonacci in forex trading or any market becomes usable. You are aligning entries with structure, not guessing reversals.
Fibonacci Extension Levels and Target Projection (Concept Introduction)
The script briefly introduces Fibonacci extension levels for projecting targets beyond the range. While not deeply covered, the idea is clear.
Once a range is defined and retracement completes, extensions help estimate how far price may expand next. These projections are also derived from the same mathematical ratios.
The concept is simple: if retracement respects structure, expansion can also follow structured proportions. But execution still depends on context, not blind expectation.
Common Mistakes Traders Make With Fibonacci
The biggest mistake is drawing on wrong swings. If the high or low is not confirmed, the entire measurement becomes invalid.
Another mistake is ignoring equilibrium. Traders buy above 50% without realizing they are buying expensive. Or they sell below 50% without understanding they are selling cheap.
Trading every level blindly creates overtrading. The script clearly shows reducing levels and focusing on key zones. Fibonacci retracement trading strategy works when simplified, not cluttered.
Final Perspective
If you want a clear answer to what is Fibonacci and how to trade with it, it comes down to four steps.
First, identify a clean range using swing high and swing low.
Second, draw left to right correctly.
Third, focus on 50% equilibrium and the golden zone.
Fourth, align your existing setup inside cheap or expensive areas.
A Fibonacci trading strategy is not about prediction. It is about measuring retracement inside a range and trading location intelligently. When used this way, Fibonacci trading strategy becomes a structured framework instead of a decorative tool on the chart.
Trade the range. Respect equilibrium. Let the price come to you.
FAQs
1. What is Fibonacci retracement in trading?
Fibonacci retracement is a tool that measures how much price has pulled back inside a defined range between a swing high and swing low. It divides the range into percentage levels like 50%, 61.8%, and 78.6% to identify potential support and resistance zones.
2. How do you use Fibonacci retracement correctly?
Draw it from a confirmed swing high to swing low using the left-to-right rule. Then focus on the 50% equilibrium level and the 61.8%–78.6% golden zone to look for buy or sell setups.
3. What are the best Fibonacci retracement levels to trade?
The most important levels are 50%, 61.8%, and 78.6%. The 50% level marks equilibrium, while 61.8% and 78.6% form the golden zone where stronger reactions often occur.
4. Why does the 61.8% Fibonacci level matter?
The 61.8% level comes from the golden ratio (1.618), which appears repeatedly in mathematical proportion. In trading, this level often acts as a strong retracement area before continuation.
5. Can Fibonacci retracement be used in forex trading?
Yes. Fibonacci in forex trading works the same way as in stocks or crypto because it measures percentage retracement inside a price range. The logic is based on range behavior, not market type.
6. Is Fibonacci retracement accurate in trading?
Fibonacci is not predictive. It is a probability-based tool that highlights potential reaction zones inside a range when combined with structure.
Responses (0)
Leave a Reply
Your email address will not be published. Required fields are marked *
You might also like

Multiple Time Frame Analysis: A Practical Swing Trading Framework
This swing trading strategy is designed for traders who struggle with timing, not ideas. Most losses don’t come from missing opportunities, but from acting during the wrong phase of the market. This framework uses multiple time frame analysis to separate planning, confirmation, and execution into distinct steps, removing emotional decision-making during live markets.
Top 3 Chart Patterns in Trading You Must Know as a Beginner
Are trading charts going over your head? Then look no further - This guide will break down the top essential chart patterns in trading, signal market movements, practical strategies, risk management, and common mistakes to avoid as a beginner.