Technical Analysis for Beginners: Charts & Candlesticks Guide
Technical Analysis is the study of price charts to understand how buyers and sellers are behaving in the market. It is not about predicting prices or relying on indicators. Most beginners struggle not because charts are complex, but because they misinterpret what candlesticks, trends and patterns are actually showing. This guide explains the basics of technical analysis in a clear, practical way, focusing on real price behavior, common beginner mistakes and how traders actually use charts to make informed decisions instead of guessing.


Introduction
After years of watching price charts and observing how people trade, one reality stands out:
most traders don’t fail because the market is unpredictable - they fail because they misunderstand charts.
Open a technical chart for the first time and it feels overwhelming. Green and red candlesticks moving constantly. Trend lines drawn everywhere. Indicators layered until the price itself is hard to see. Every video and blog explaining something different, often with complete confidence.
Here’s the uncomfortable truth that experienced traders eventually learn:
technical analysis is not confusing. Over-interpretation is.
Markets move because of buyers and sellers. Candlesticks simply record that interaction. Patterns don’t guarantee outcomes and indicators don’t create signals on their own. They only help you read what is already happening in price.
This guide explains the basics of technical analysis the way it is taught after years of real market observation - patiently, practically and without shortcuts. It focuses on how traders actually read charts, why beginners commonly get stuck and how to build clarity before trying to trade.
If charts have ever felt noisy or intimidating, this is where they start making sense.
What Is Technical Analysis?
Instead of focusing on company financials, earnings or news, technical analysis looks at what price is actually doing. The core idea is simple: all information like news, expectations, fear and greed - is reflected in price.
- When buyers dominate, price moves up.
- When sellers dominate, price moves down.
Charts visually capture this interaction between buyers and sellers.
By analyzing past price behavior, traders identify trends, patterns and key price levels where markets often react. These patterns repeat because markets are driven by human behavior, which remains consistent over time.
Technical analysis also uses indicators and volume to measure strength and momentum. These tools don’t predict the future; they help assess whether a move is strong or weakening. In practice, technical analysis helps traders decide where price may move next, when to enter or exit and whether the risk is worth the potential reward.
Unlike fundamental analysis, which estimates value, technical analysis treats price as the final authority, because price reflects every decision made in the market.
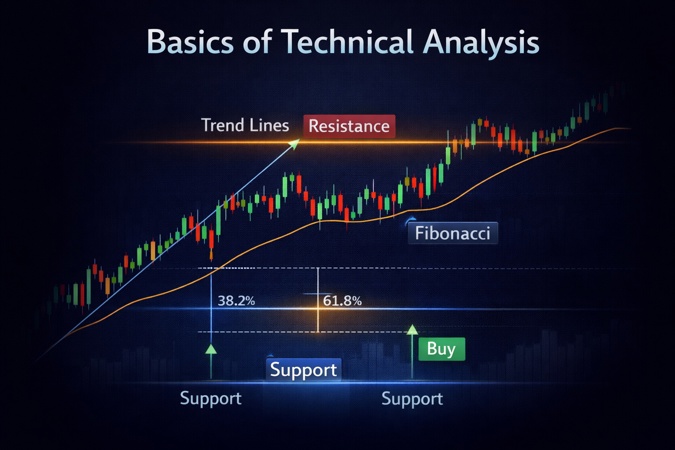
How to Read Technical Charts? (And Which Chart Is Better)
Reading technical charts involves understanding how price is moving, who is in control and where the market is likely to react next. Charts don’t predict the future - they visually show the ongoing fight between buyers and sellers.
Core Elements of Reading a Price Chart
A price chart simply shows how price moves over time as buyers and sellers interact.
- Price movement (price action) reflects market behavior. Smooth moves show confidence. Choppy movement shows uncertainty. Sharp rejections often hint that price may change direction.
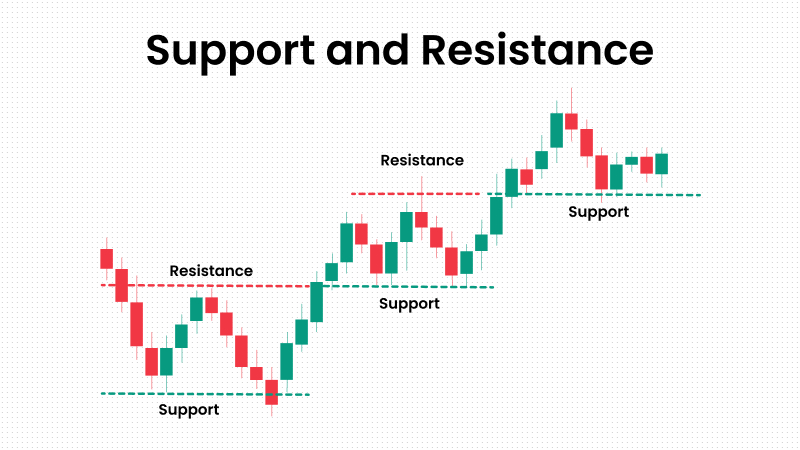
- Trends and key levels help traders understand structure. Support and resistance form where price repeatedly reacts because traders consistently make decisions at those levels.
- Timeframes change perspective: 1-minute shows noise, 5-15 minute smooths moves, daily shows structure, the market stays the same.
- Volume validates price action. Strong moves with high volume show participation. Low volume suggests weak or unreliable movement.
Which Chart Is Better?
There is no single “best” chart. It depends on purpose.
For learning and reading market behavior, clean candlestick charts work best because they clearly show price structure and control without confusion.
The best chart is the one that helps you clearly see who is in control - buyers or sellers.
What Are Candlesticks?
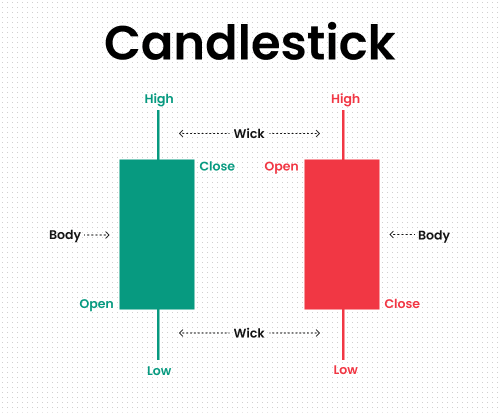
Candlesticks visually show price movement within a specific timeframe using open, high, low and close data. They help traders quickly understand market behavior and sentiment.
Each candlestick represents how price moved during that period, whether buyers or sellers were in control.
Key Components
- Real body: Shows the range between opening and closing prices
- Bullish candle: Closing price is higher than the opening price.
- Bearish candle: Closing price is lower than the opening price.
- Wicks: Show the highest and lowest prices reached during the timeframe
How Traders Use Candlesticks
- Candlestick patterns help identify potential trend continuation or reversals.
- Long bodies suggest strong buying or selling pressure.
- Long wicks indicate rejection and higher volatility.
- Short wicks suggest limited price movement and lower volatility.
This is why candlesticks are widely used - they clearly display price behavior, not just direction.
Types of Candlesticks
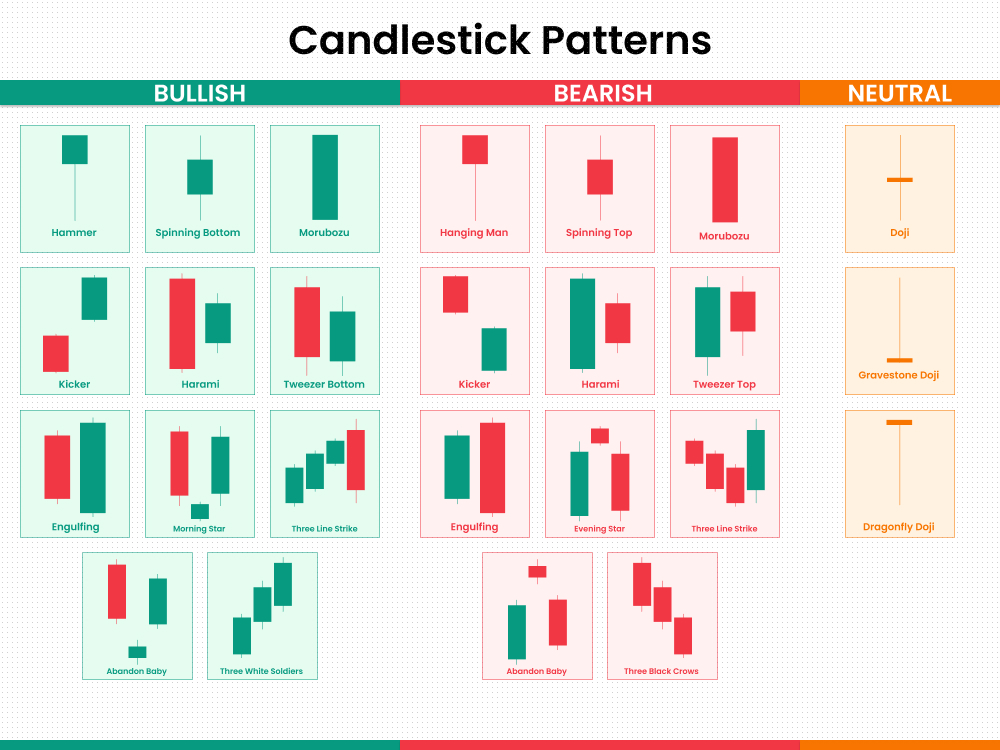
Candlesticks visually represent four prices: open, high, low and close. Instead of predicting the future, they help traders read pressure, rejection, strength and hesitation in the market.
Common Single-Candlestick Patterns
|
Pattern |
What It Shows in the Market |
|
Doji |
Buyers and sellers are balanced; the market is undecided and may pause or reverse. |
|
Hammer |
After a fall, buyers step in strongly and reject lower prices. |
|
Inverted Hammer |
Buying pressure appears after a downtrend despite selling attempts. |
|
Shooting Star |
Sellers reject higher prices near market highs, hinting at weakness. |
|
Hanging Man |
Buying strength may be fading after an uptrend, warning of a potential reversal. |
|
Marubozu |
One side dominates the session completely, showing strong momentum. |
|
Spinning Top |
Uncertainty in the market, with neither buyers nor sellers in control. |
Common Multi-Candlestick Patterns (Reversal)
|
Pattern |
What It Signals |
|
Bullish Engulfing |
Buyers fully overpower sellers, often starting a reversal upward. |
|
Bearish Engulfing |
Sellers completely take control after buying strength. |
|
Morning Star |
Selling pressure weakens and buyers begin to regain control. |
|
Evening Star |
Buying momentum fades and sellers step in strongly. |
|
Three White Soldiers |
Strong and sustained buying after a decline. |
|
Three Black Crows |
Strong and sustained selling after an advance. |
|
Harami (Bullish / Bearish) |
Momentum slows, signaling hesitation and possible reversal. |
Key Takeaway
Candlesticks are not predictions. They are visual evidence of market behavior. When read with trend, levels and context, they help traders understand who is gaining control and who is losing it.
Swing Highs and Swing Lows
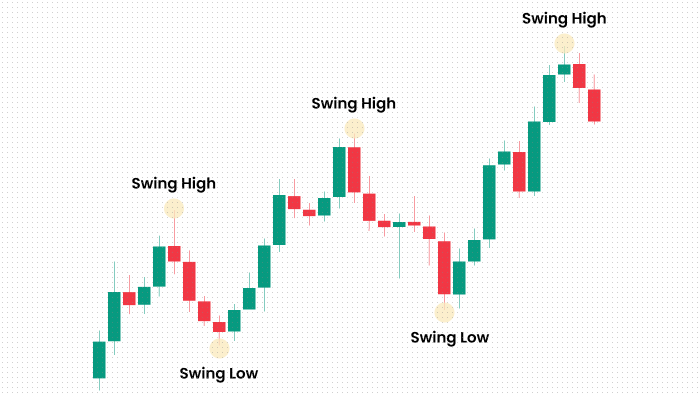
- A swing high forms when price moves up, runs out of buying strength and turns down.
- A swing low forms when price moves down, selling pressure fades and buyers step in.
These swings are not random. They define market structure. When price keeps making higher highs and higher lows, the market is in an uptrend. When it forms lower highs and lower lows, the trend is down.
Experienced traders read swings to understand intent. They reveal where strong orders entered the market, where price is likely to react again and where risk can be controlled. Stops, entries and exits are often built around these levels.
Before indicators, swings teach you how price truly moves - clean, direct and without delay.
How to Identify Swing Highs and Swing Lows
Marking swing points accurately doesn't have to be complicated. You just need a straightforward approach you can apply consistently.
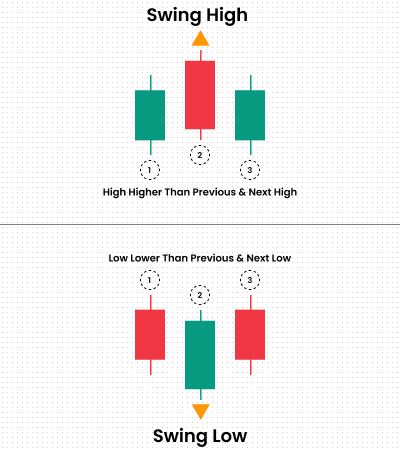
Pick any starting point on your chart and look at the candles in sets of three.
You've got a swing high when the candle in the middle has a higher high than both its neighbors - the one before it and the one after it. That middle candle is showing you where price temporarily peaked. Mark the high of that candle as your swing high, and that's where you'll draw your level.
For a swing low, it works the opposite way. The middle candle needs to have a lower low than the candles on either side of it. This tells you where price found a temporary bottom. Mark the low of that middle candle as your swing low.
Just move through your chart one candle at a time, applying this three-candle rule as you go. You'll be able to identify and mark every significant swing high and swing low without missing any.
This method keeps things objective and takes the guesswork out of your analysis. You'll get a much clearer picture of the market structure that's actually developing.
Common Mistakes Beginners Should Avoid
Don’t overload charts — too many indicators create noise, while price already tells the story.
Don’t jump between timeframes — it leads to emotional and inconsistent decisions.
Don’t trade without structure — ignoring trend and swing levels turns trading into guessing.
Don’t chase fast moves — missed trades cost nothing, bad trades cost capital.
Don’t skip practice — markets reward experience built on charts, not information consumed.
How to Use Technical Analysis in Your Trading Plan
Technical analysis only works when it’s part of a clear plan, not random decisions on a chart. The first step is understanding direction. Always identify the trend using higher timeframes before looking for trades. Trading against structure usually leads to frustration.
Next, mark support and resistance - these are areas where price has reacted before and is likely to react again. They give context to every entry and exit.
Indicators should be used sparingly and only for confirmation, not decision-making. Tools like moving averages or RSI help judge momentum and strength, but price must lead.
Every trade needs defined rules - where you enter, where you exit and where you accept being wrong. Stops belong beyond structure, not at random points.
Most importantly, follow your plan consistently. Discipline, not prediction, is what turns technical analysis into a usable trading system.
Frequently Asked Questions
1. What is technical analysis used for?
Technical analysis is used to understand price behavior, identify trends and plan trade entries, exits and risk levels using charts.
2. Can beginners rely on technical analysis?
Yes. When learned properly, technical analysis helps beginners read market direction and avoid emotional decision-making.
3. Do candlestick patterns work without indicators?
Yes. Candlestick patterns work best when read with price structure and key levels, even without indicators.
4. Which chart timeframe is best for beginners?
Higher timeframes like 15-minute or daily charts are better for beginners because they show clearer market structure.
5. Is technical analysis better than fundamental analysis?
Technical analysis focuses on market behavior, while fundamental analysis focuses on value. Many traders use both, depending on their goals.
Conclusion
Technical analysis isn’t about predicting the future. It’s about reading price clearly. Markets move because buyers and sellers act, hesitate, panic and commit - overthinking creates confusion, not charts.
Candlesticks show behavior, swings show direction, trends show intent. With practice, patience, and respect for risk, clarity replaces complexity and decision-making becomes calm and controlled.
Responses (0)
Leave a Reply
Your email address will not be published. Required fields are marked *
You might also like

Multiple Time Frame Analysis: A Practical Swing Trading Framework
This swing trading strategy is designed for traders who struggle with timing, not ideas. Most losses don’t come from missing opportunities, but from acting during the wrong phase of the market. This framework uses multiple time frame analysis to separate planning, confirmation, and execution into distinct steps, removing emotional decision-making during live markets.
Top 3 Chart Patterns in Trading You Must Know as a Beginner
Are trading charts going over your head? Then look no further - This guide will break down the top essential chart patterns in trading, signal market movements, practical strategies, risk management, and common mistakes to avoid as a beginner.