Three Drive Pattern Strategy: How to Trade after Stop-Loss Hunting
The Three Drive Pattern is a price action strategy that helps traders enter after stop-loss liquidity is taken, not before. Instead of trading sweeps or guessing reversals, the strategy waits for three liquidity drives followed by a clear market structure break. Trades are taken only if structure confirms intent and the market offers at least a 1:1 risk-to-reward toward the next swing high or swing low.


Introduction: Why Traders Get Stopped Out Before the Real Move
Almost every trader has experienced this. Price reaches a level that looks correct. The setup aligns. The stop loss is logical. Price briefly dips, takes the stop and then moves cleanly in the original direction.
This repetition leads traders to doubt either the market or themselves. In reality, neither is the problem. What is occurring is a structural behavior driven by liquidity.
In live market conditions, price rarely moves directly from one level to another. It tests, rejects and revisits areas where orders are concentrated. Stop losses create accessible liquidity. Once that liquidity is absorbed, price is free to move.
The solution is not avoiding stops or widening them emotionally. The solution is aligning execution with what happens after stops are taken. The Three Drive Pattern provides a structured framework for doing exactly that.
What Is Stop-Loss Hunting? (Brief Context)
Stop-loss hunting occurs when price briefly moves into areas where retail traders have placed clustered stop losses, triggers those stops and then fails to continue in that direction. These clusters typically form just below swing lows, just above swing highs and around obvious support and resistance zones.
- The defining feature is failure, not the sweep itself.
- If price breaks a level and accepts beyond it, continuation follows.
- If price breaks a level and is immediately rejected, that rejection is information.
On lower timeframes, this behavior becomes exaggerated. Wicks extend further, reversals happen faster and traders experience stop-outs more frequently. This is why scalpers feel targeted, even though the behavior is structural rather than personal.
Is Stop-Loss Hunting Real?
Stop-loss hunting is a real market behavior caused by liquidity clustering, not manipulation. Price moves toward areas where many stop-loss orders exist, fills those orders and then reveals direction once liquidity is absorbed.
Liquidity and Market Intent
Liquidity is the fuel of all price movement. Without orders, price cannot travel. Retail stop losses provide accessible liquidity because they are predictable and often clustered at identical technical levels.
When price approaches these zones, it is not choosing direction. It is completing unfinished business. Often, one attempt is not enough. Price may return to the same level multiple times, each time removing participants from the market.
This is where most traders lose consistency. They expect the first or second test to work. When it does not, frustration sets in. This is also why backtests often look clean while live execution feels chaotic. Backtests compress this behavior visually. Live trading forces you to experience it in real time.
Direction becomes clear only after liquidity has been absorbed.
The Solution: The Three Drive Pattern Strategy
What Is the Three Drive Pattern?

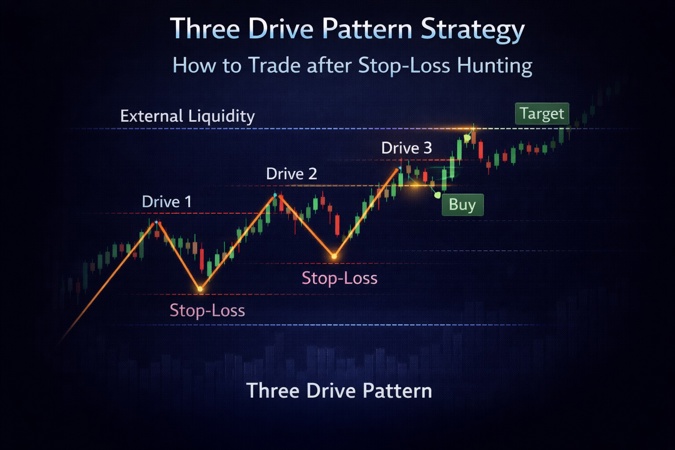
Image example of the Three Drive Pattern showing repeated stop-loss hunts, a confirmed market structure break, and a 1:1 risk-reward execution.
The Three Drive Pattern is a price action strategy where the market attempts to break the same level three times, clearing stop-loss liquidity with each attempt. After the third failed drive, price shifts structure, signaling a potential reversal driven by exhaustion rather than prediction.
This pattern is not based on Fibonacci ratios or harmonic symmetry. It is behavioral price action rooted in how traders enter early, place risk predictably and exit emotionally.
A chart example of the Three Drive Pattern clearly illustrates repeated failure followed by a decisive structure shift.
The Logic behind the Three Drives
Each drive serves a purpose.
- The first drive removes early entries reacting to obvious levels.
- The second drive removes disciplined traders who waited but placed stops predictably.
- The third drive exhausts remaining participation.
By the third attempt, most traders have either been stopped out or disengaged. At that point, price no longer needs to search for liquidity. Control shifts and structure begins to change.
The pattern itself is observation.
Execution begins only after confirmation.
Bullish and Bearish Three Drive Structures
The Three Drive Pattern appears in two forms. The logic remains the same; only the direction changes.
Bullish vs Bearish Three Drive Pattern
|
Aspect |
Bullish Three Drive Pattern |
Bearish Three Drive Pattern |
|
Liquidity location |
Below a support zone |
Above a resistance zone |
|
Type of stop-loss hunt |
Long lower wicks or failed breakdowns |
Upper wicks or failed breakouts |
|
Number of drives |
Three repeated liquidity sweeps |
Three repeated liquidity sweeps |
|
Trader behaviour removed |
Buyers stopped out below support |
Sellers stopped out above resistance |
|
Confirmation signal |
Break of a meaningful swing high |
Break of a meaningful swing low |
|
Market intent after break |
Buyers take control |
Sellers take control |
|
Trade validity |
Only after structure breaks |
Only after structure breaks |
Key rule:
No trade is taken before market structure breaks.
Entry Rules
This is where theory ends and execution begins.
Trades are never entered on the third drive itself. That is where most traders lose money. Entry is allowed only after a clear market structure break confirmed by a candle close. Wicks alone are not enough.
After structure breaks, entry can be taken on the break or on a shallow retest. The exact entry technique matters less than the confirmation itself.
- Pattern does not equal trade.
- Confirmation equals permission.
How Do You Trade After Stop-Loss Hunting?
Stop-loss hunting is traded by waiting for liquidity to be taken first and entering only after market structure breaks. Traders do not trade the sweep itself. They trade the confirmation that follows rejection and structural shift.
Stop-Loss Placement Logic
Stop placement should never be predictable. Stops must be placed beyond the last drive, not at the level that was just swept. That area has already proven to be a liquidity zone.
If your stop is obvious, you become liquidity. Structural stops align risk with intent rather than fear.
Targeting and Risk Management
After structure breaks, the market often attempts to reach the next available swing high or swing low. These levels matter because unfilled orders remain there.
Trades should not be taken if the risk-to-reward ratio is less than 1:1. If the market does not offer that, the trade is skipped. Partial profits can be booked and remaining positions can be managed using structure.
Market structure determines exits, not arbitrary ratios.
When NOT to Trade the Three Drive Pattern
Avoid this setup when the market is trending aggressively with no corrective structure, when fewer than three liquidity sweeps have occurred, when no structure shift appears after the third drive, during extremely low-volume conditions, or when trades are being forced after recent losses.
This pattern works best in ranges and corrective phases where liquidity behaviour is visible.
When Should You NOT Trade the Three Drive Pattern?
The Three Drive Pattern should not be traded during strong impulsive trends, when only one liquidity sweep has occurred, or when price fails to show a clear market structure shift after the third drive.
Three Drive Pattern Execution Checklist
Before entering any trade, confirm:
- At least two stop-loss hunts have occurred
- A third drive has formed
- Price shows rejection, not acceptance
- Market structure has clearly broken
- The next swing high or swing low is identifiable
- Minimum risk-to-reward of 1:1 is available
If any condition is missing, no trade.
Final Perspective
When price repeatedly sweeps the same level without acceptance, liquidity is being absorbed. After the third attempt, a break in market structure signals that participation has shifted.
The Three Drive Pattern works because it aligns execution with this shift instead of anticipating it.
Stop-loss hunting is not the market targeting traders. It is a natural process. Consistency comes from waiting for proof, not predicting outcomes.
Trade structure, not hope.
Wait for intent.
Then act.
FAQs
1. Is the Three Drive Pattern a Fibonacci or harmonic pattern?
No. This strategy is based on liquidity behavior and market structure, not Fibonacci ratios or harmonic symmetry.
2. Can beginners trade the Three Drive Pattern?
Beginners can study it, but execution requires patience and structure awareness. Trading without confirmation leads to losses.
3. Does the Three Drive Pattern work on all markets?
Yes. It applies to stocks, indices, forex and futures because it is based on price behavior, not instruments.
4. Why is a 1:1 risk-to-reward required?
If the market does not offer at least 1:1 after structure breaks, the setup does not justify the risk. No trade.
5. How do I confirm that a real market structure break has occurred?
A valid structure break occurs when price closes beyond a meaningful swing high or swing low after the third drive. Wicks alone are not sufficient.
6. Should I enter on the structure break or wait for a retest?
Both approaches are valid. Entry can be taken on the break or on a shallow retest, provided structure has already shifted.
Responses (0)
Leave a Reply
Your email address will not be published. Required fields are marked *
You might also like

Multiple Time Frame Analysis: A Practical Swing Trading Framework
This swing trading strategy is designed for traders who struggle with timing, not ideas. Most losses don’t come from missing opportunities, but from acting during the wrong phase of the market. This framework uses multiple time frame analysis to separate planning, confirmation, and execution into distinct steps, removing emotional decision-making during live markets.
Top 3 Chart Patterns in Trading You Must Know as a Beginner
Are trading charts going over your head? Then look no further - This guide will break down the top essential chart patterns in trading, signal market movements, practical strategies, risk management, and common mistakes to avoid as a beginner.